


Optical coherence tomography (OCT) is a noninvasive ophthalmic imaging modality that has become the workhorse of retinal disease management.
With the ability to provide high-resolution in-vivo imaging of the choroid, retina, and posterior vitreous, it is clear to see why OCT imaging has become the standard of care in the management of numerous ophthalmic conditions.
This article will review some of the most common findings and conditions that can be distinguished with OCT.
Introduction to optical coherence tomography
OCT technology takes advantage of the varied light reflectivity of ocular tissues. Homogenous structures, such as the vitreous and outer nuclear layer, allow light to pass relatively undisturbed and appear as black/dark gray (or cooler colors if using the color scale). Heterogenous structures, such as the retinal nerve fiber layer and retinal pigment epithelium (RPE), tend to reflect more light and will appear as white/bright gray (warmer colors on color scale) areas on the OCT image.
Though OCT imaging provides near histological resolution of ocular tissues, we must always be aware that we are viewing the retina as the OCT “sees” it and not as we would see it with a microscope. Due to the complex intracellular and intercellular retinal structure, OCT structures may not always correlate to retinal anatomy.
The bright outer retinal bands are a perfect example of this, with the latest nomenclature preferring to use “zone” for the anatomically ambiguous OCT structures myoid zone, ellipsoid zone, interdigitation zone.1
Figure 1 features a normal macular OCT B-scan.

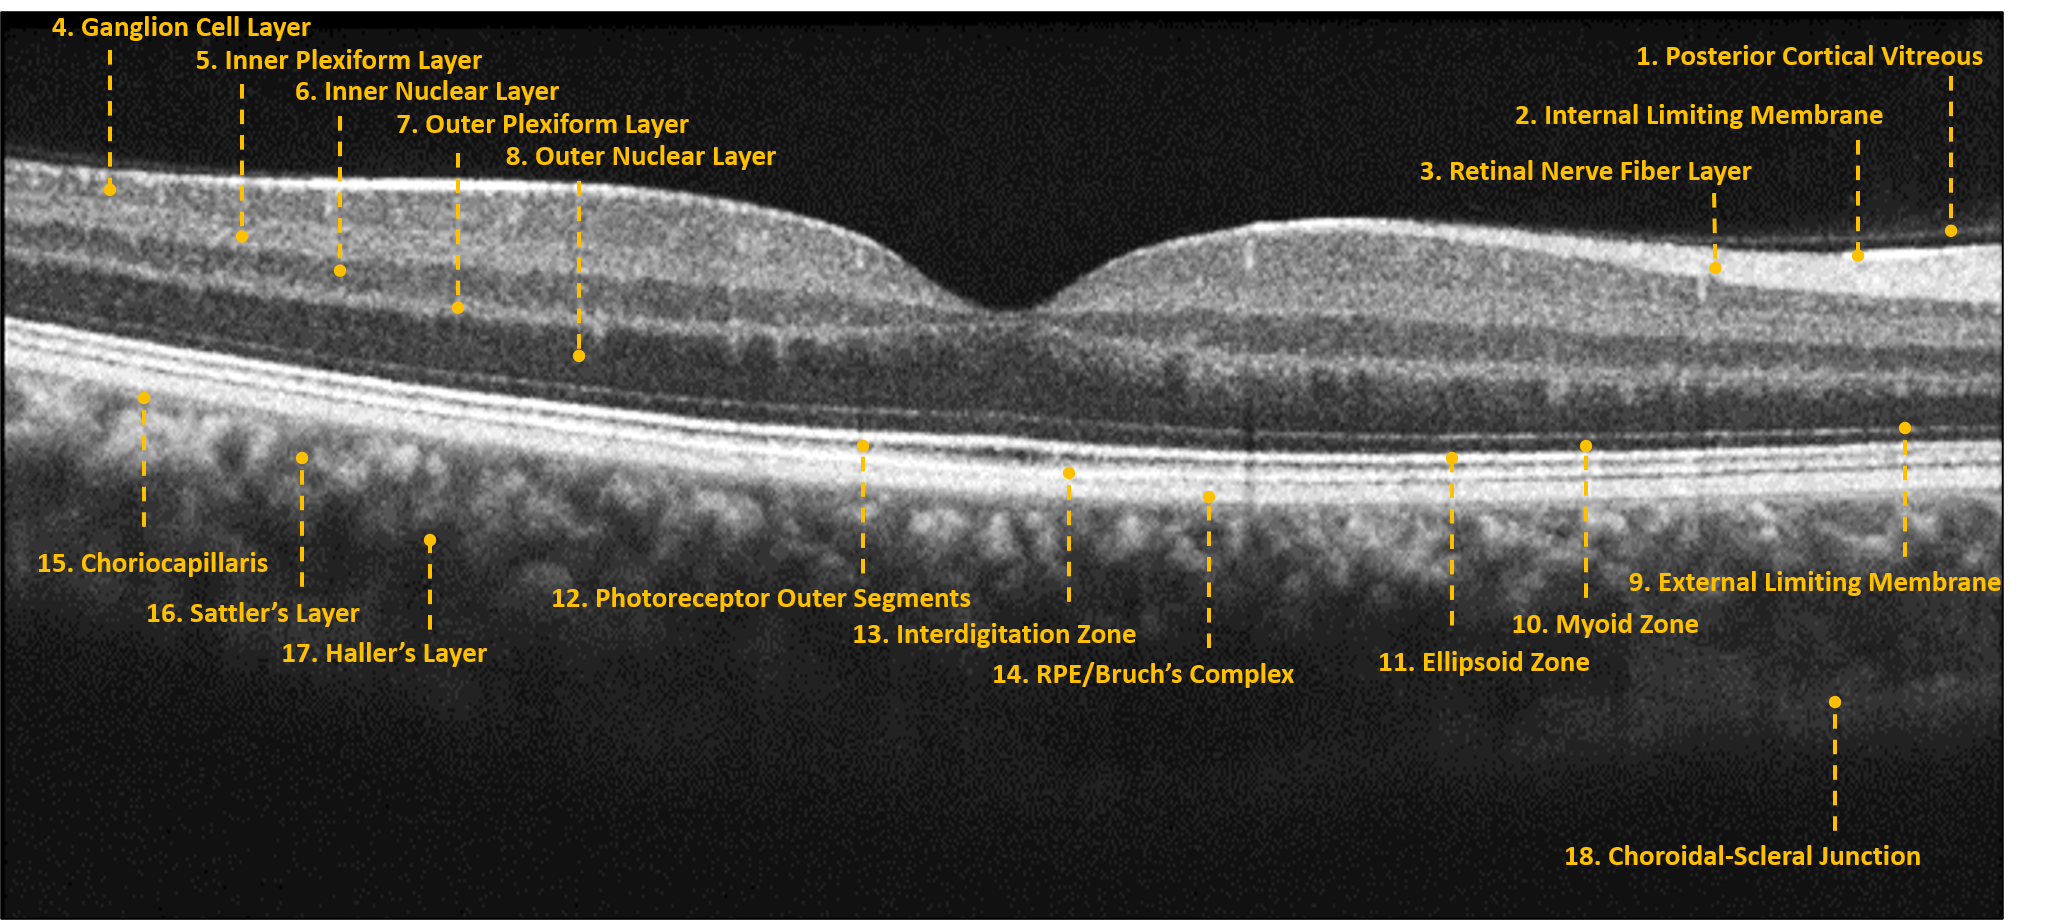
Figure 1: Courtesy of Daniel Epshtein, OD, FAAO
Download the Retina OCT Cheat Sheet!

Retina OCT Cheat Sheet
Use this cheat sheet, featuring a labeled OCT scan and retinal report, to broaden your understanding of the applications of OCT imaging in identifying and monitoring retinal diseases.

Interpreting B-scans, retinal reports, and progression analytics
When evaluating retinal pathology with OCT, it is important to take advantage of both the generated reports and qualitative analysis of individual B-scans. Though the retina reports differ between the various OCT models, they all consist of at least one foveally centered B-scan, quantitative thickness map, and semi-quantitative thickness map.
The B-scan provides a snapshot of foveal architecture and helps ensure that the scan was centered properly. The quantitative thickness map, uses the ETDRS sector map to measure the retinal thickness within a 6mm circle centered on the fovea. The foveal sector is 1mm in diameter, the inner macular ring is 3mm, and the outer macular ring is 6mm.
Progression analytics can be used to compare serial macular scans, which is extremely useful in the management of vitreomacular interface disorders and macular edema. The semi-quantitative thickness map provides an overview of the retinal thickness within the entire scan. The semi-quantitative map of the macula often looks like a donut, with a thin fovea, a thick perifoveal area, and a thin perimacular region. Any deviation from these normal features should prompt a scrutinization of the individual B-scans that correspond to the area of interest.
The retina report provides a great summary of macular OCT imaging, but it is important to always analyze the individual B-scans in tandem with any retina report. Ideally, a high-definition raster scan should be completed in addition to the standard cube scan (used to generate the retina report) when diagnosing/managing any macular pathology.
Figure 2 highlights the retina report of a normal patient.

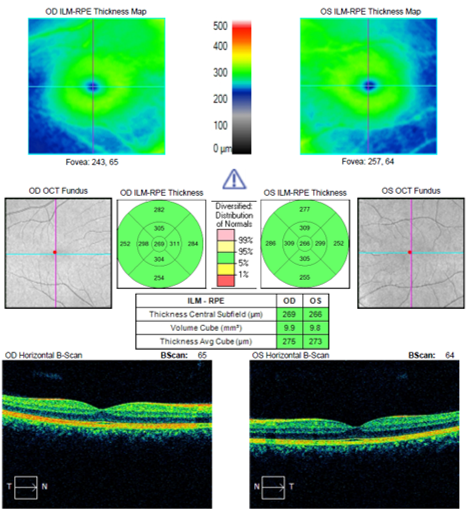
Figure 2: Courtesy of Daniel Epshtein, OD, FAAO
Using OCT to identify vitreomacular interface disease
As the vitreous ages, the gel-like structure begins to liquify, and the vitreoretinal adhesions weaken. This degenerative process eventually culminates in a posterior vitreous detachment, often accompanied by symptoms of acute floaters and photopsias. In a subset of patients, an incomplete or anomalous posterior vitreous detachment will occur.
This persistent vitreoretinal attachment can lead to vitreomacular traction, which is characterized by foveal contour irregularity, pseudocyst formation, and/or foveal detachment. In mild cases, patients are often asymptomatic, but more advanced cases can develop blurred vision and metamorphopsia.
Vitreomacular adhesion
Vitreomacular adhesion occurs when the posterior cortical vitreous incompletely separates from the retina without any alteration in the retinal structure. Vitreomacular adhesion can be thought of as a normal phase of the vitreoretinal relationship, and no intervention is thought to be necessary. Also, it can be classified as either focal (≤1500μm) or broad (≥1500μm) and isolated or concurrent, depending on the presence or absence of comorbid retinal disease.2
Figure 3 is an OCT scan showing broad isolated vitreomacular adhesion. Note the posterior cortical vitreous pulling away from the retina without altering the retinal architecture.

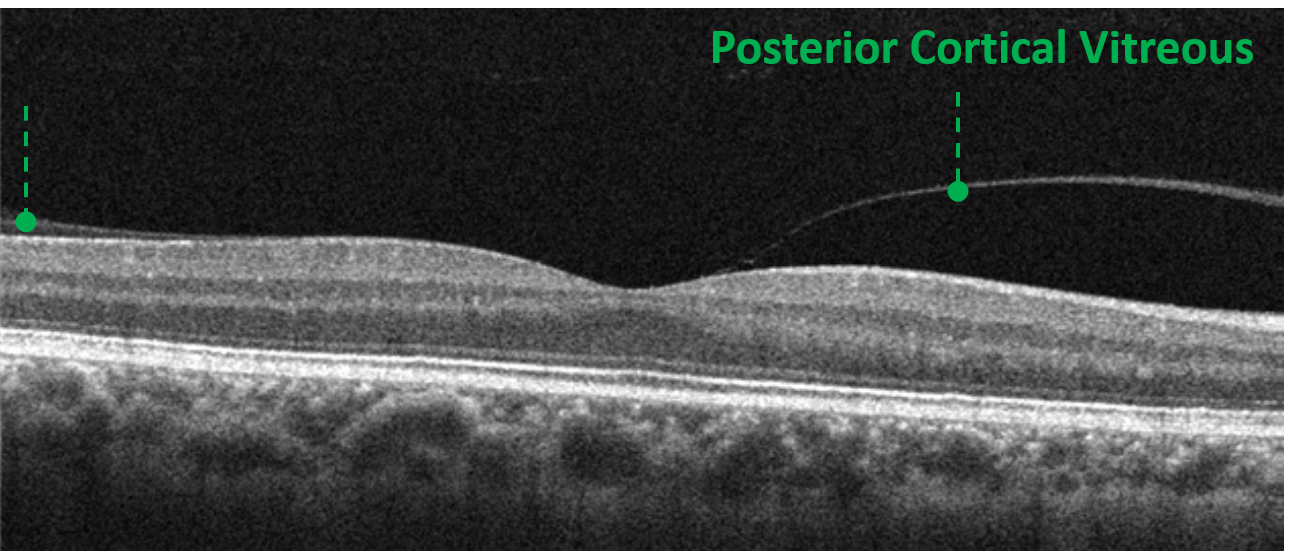
Figure 3: Courtesy of Daniel Epshtein, OD, FAAO
Vitreomacular traction
Vitreomacular traction (VMT) occurs when the posterior cortical vitreous incompletely separates from the retinal surface and causes disruption in the retinal architecture. Vitreomacular traction is classified as either focal (≤1500μm) or broad (≥1500μm) and isolated or concurrent depending on the presence or absence of comorbid retinal disease.2 Progressive vitreal degeneration can lead to spontaneous resolution or development of a macular hole.
Small-scale OCT-based longitudinal studies have noted that 26 to 43% of isolated vitreomacular traction cases will resolve spontaneously.3,4 For this reason, observation with serial OCT imaging is often recommended in cases of isolated vitreomacular traction. In persistent or complicated cases, pharmacological vitreolysis, pneumatic vitreolysis, or vitrectomy can be performed.
Figure 4 is an OCT scan demonstrating vitreomacular traction caused by the posterior cortical vitreous pulling away from the retina but still being tightly bound at the fovea.

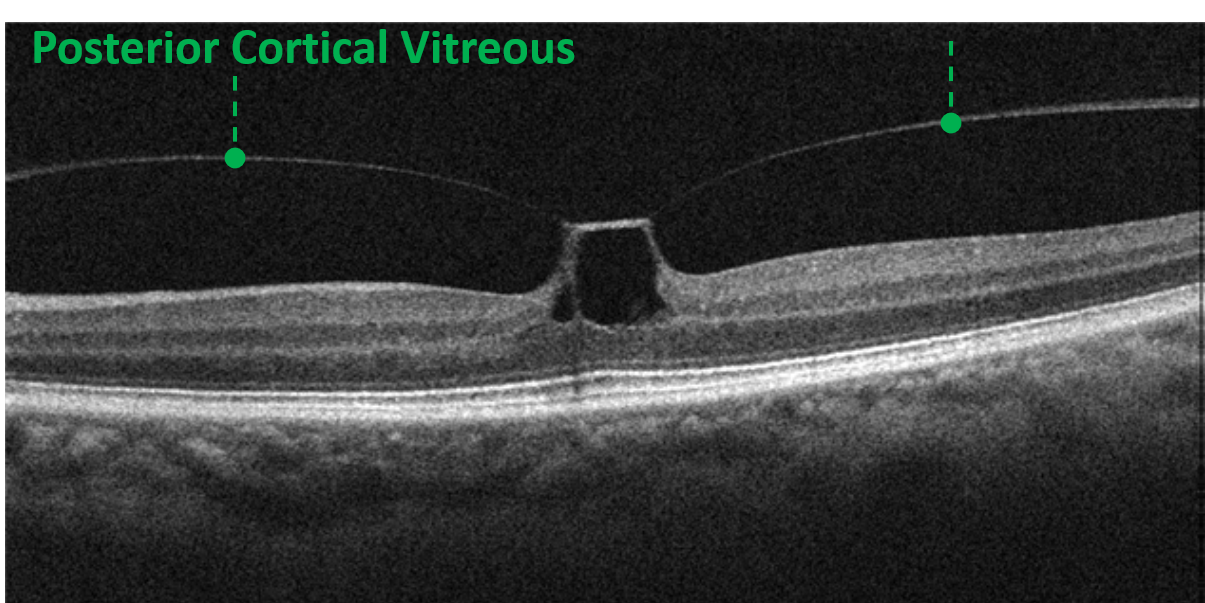
Figure 4: Courtesy of Daniel Epshtein, OD, FAAO
Full-thickness macular hole
Full-thickness macular holes (FTMHs) are disruptions of all retinal layers from the internal limiting membrane down to, but not including, the retinal pigment epithelium. The edges of the full-thickness macular hole tend to be rolled anteriorly and may contain cystic spaces. Vitreomacular traction or an overlying operculum may sometimes be visualized as well. Idiopathic FTMHs spontaneously arise from pathological tangential and antero-posterior vitreoretinal forces, and are the most common type of FTMH.
“They can also develop secondary to trauma, chronic macular edema, or vitreoretinal surgery.”
FTMHs can be subdivided into small (≤250μm), medium (251 to 399μm), and large (>400μm) depending on their minimum aperture width size.2 They are classified by size because each category has its own rate of treatment success with pneumatic vitreolysis, pharmacological vitreolysis, or pars plana vitrectomy.
Earlier intervention is associated with improved postoperative acuity and higher closure rates. Pars plana vitrectomy is the gold standard intervention for idiopathic FTMHs with closure rates of ~90% in small and medium macular holes, whereas large and chronic FTMHs have lower and more variable rates of closure.5
Figure 5 features an OCT scan of a large idiopathic full-thickness macular hole with the minimum aperture width denoted in red.

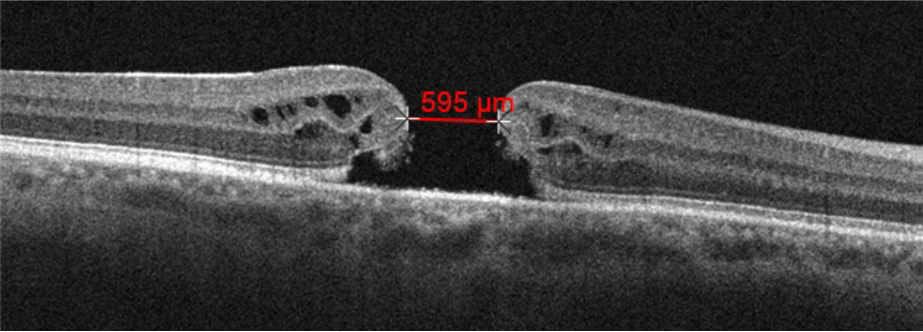
Figure 5: Courtesy of Daniel Epshtein, OD, FAAO
Lamellar macular hole
Lamellar macular holes (LMHs) are inner retinal defects with an intact photoreceptor layer.2 The inner retinal defect consists of retinal schisis and/or tissue loss. The pathogenesis of LMHs is still unclear but can be thought of as incomplete FTMHs.
It is likely that several pathogenic processes, such as inner retinal avulsion secondary to VMT, disruption via epiretinal membrane tractional forces, and retinal degeneration, all lead to the clinical finding of LMH.
Figure 6 highlights OCT imaging of a lamellar macular hole with associated epiretinal membrane. Note the inner retinal schisis and intact outer retina.
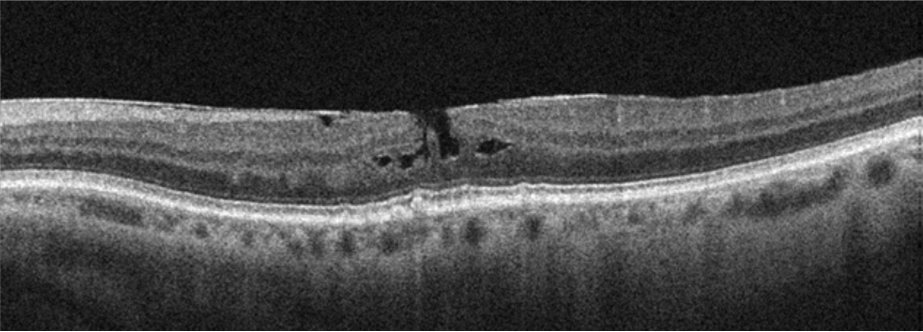
Figure 6: Courtesy of Daniel Epshtein, OD, FAAO
Macular pseudoholes
Macular pseudoholes are foveal defects caused by epiretinal membrane (ERM) tractional forces.2 The membrane alters the foveal contour, often leading to a deeper rectangular foveal pit without retinal tissue loss. Funduscopically, these lesions will look like round-ovoid reddish defects with a surrounding epiretinal membrane.
Figure 7 shows OCT imaging of a macular pseudohole. Note the associated epiretinal membranes and rectangular, verticalized foveal pit.

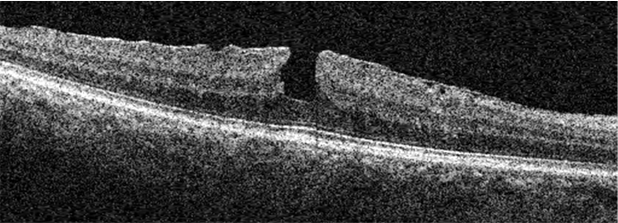
Figure 7: Courtesy of Daniel Epshtein, OD, FAAO
Epiretinal membranes
ERMs are fibrous proliferations along the vitreoretinal interface thought to be caused by glial cell proliferation. ERMs can be visualized as hyper-reflective sheetlike structures along the retinal surface. As the ERM grows and contracts, it can lead to retinal disruption, retinal thickening, cystic formation, macular schisis, and foveal detachment. Patients may often complain of metamorphopsia and/or blurred vision.
Figure 8 is an OCT scan of moderate epiretinal membrane with significant foveal disruption.

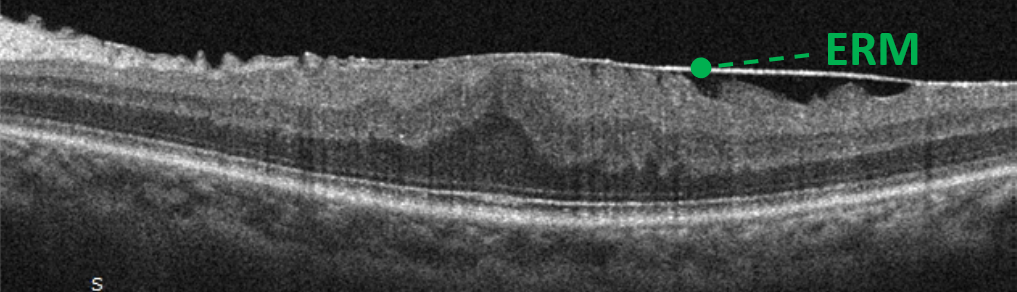
Figure 8: Courtesy of Daniel Epshtein, OD, FAAO
Using OCT to identify age-related macular degeneration
Age-related macular degeneration (AMD) is a macular deterioration, most often occurring in patients over 50 years of age, characterized by drusen, pigmentary abnormalities, geographic atrophy, and/or choroidal/macular neovascularization, not explained by another retinal condition. Though often a clinical diagnosis, the use of OCT has become the standard of care in AMD due to its ability to identify various microstructures important in proper diagnosis, prognostication, and treatment.
Drusen and drusenoid deposits
Drusen are extracellular accumulations of debris found in the sub-RPE space. When imaged with OCT, drusen appear as iso-reflective to hypo-reflective semicircular structures with their base on Bruch’s membrane and their apex towards the retina.
Drusen can be classified by their size:
- Small drusen/drupelets are less than <63μm in base diameter
- Medium/intermediate drusen are ≥63μm and ≤125μm
- Large drusen are >125μm
It is important to use the caliper measurement tool with OCT to measure the base diameter of clinically largish drusen, as the presence of even one large druse will push a patient’s diagnosis from early AMD to intermediate AMD. This change in diagnosis also comes with different risk factors and intensification of treatment to prevent vision loss.
Subretinal drusenoid deposits are clinically and histologically similar structures to drusen. Unlike drusen, which form between Bruch’s membrane and the retinal pigment epithelium (RPE), subretinal drusenoid deposits are found anterior to the RPE. It is important to accurately diagnose subretinal drusenoid deposits because they confer a significantly higher risk of geographic atrophy formation than drusen.
Drusen and subretinal drusenoid deposits are often transient structures that can change size, shape, and even resorb. Drusen resorption is often the harbinger of outer retinal atrophy, vision loss, or advanced AMD; therefore, these patients should be monitored more closely.
Figure 9 shows OCT scans of drusen on the left and subretinal drusenoid deposit on the right. Note the location of the RPE anterior to the druse and posterior to the subretinal drusenoid deposit.

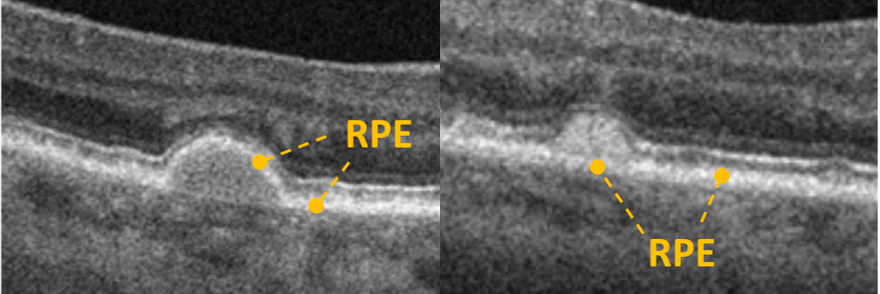
Figure 9: Courtesy of Daniel Epshtein, OD, FAAO
Geographic atrophy
Geographic atrophy is essentially a clinical term used to denote funduscopic areas of retinal and RPE atrophy. Recently, the Classification of Atrophy Meetings group has created a new international consensus classification system for atrophy secondary to AMD. Complete RPE and retinal atrophy (cRORA) is an OCT-based definition (see Table 1) of atrophic AMD lesions loosely synonymous with clinical geographic atrophy in older classification systems.6
“When visualized with OCT, the RPE will be attenuated, disrupted, or absent with degeneration of the overlying outer retina.”
The choroid will be hyper-reflective and seen in greater detail due to the loss of the RPE’s masking effect, which absorbs much of the OCT signal. An incomplete RPE and retinal atrophy (iRORA) is a precursor to cRORA and may become an important entity as treatments for geographic atrophy are approved.7
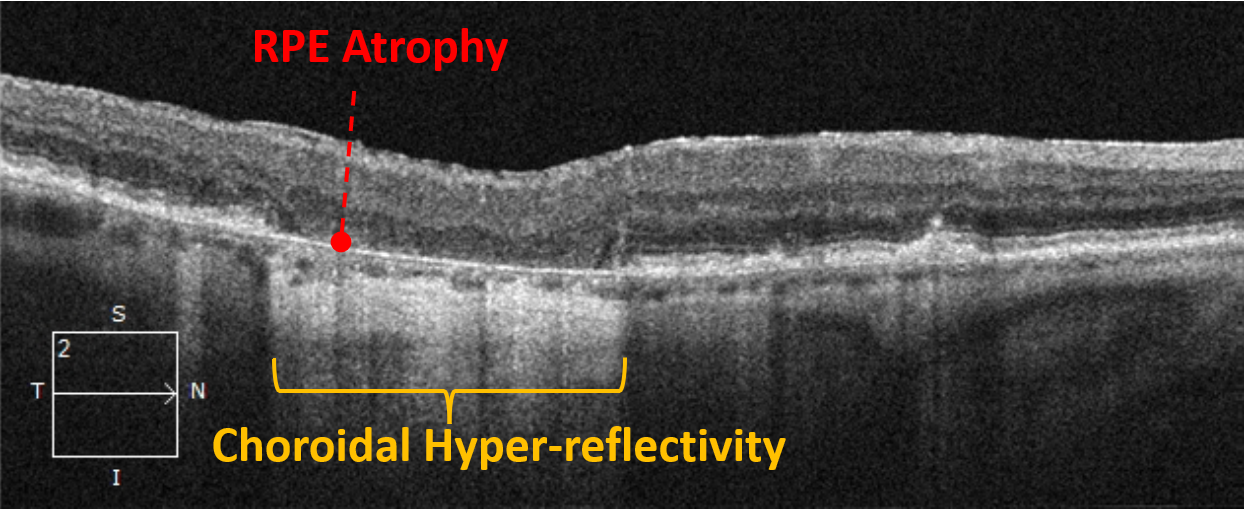
Figure 10 demonstrates an OCT scan of cRORA. Note the vertically aligned outer retinal atrophy with overlying inner retinal collapse, RPE atrophy, and choroidal hyper-reflectivity.

Macular neovascularization
Since neovascularization within the macula can originate from the choroidal or the retinal circulation, the term choroidal neovascularization has been replaced with a less specific term, macular neovascularization (MNV).8 There are three types of MNV (summarized in Table 1), all of which can lead to subretinal fluid, intraretinal fluid, hemorrhage, lipid exudation, and/or fibrosis.
Table 1 outlines different findings associated with age-related macular degeneration and how to identify them.
| AMD Finding | Description |
|---|---|
| iRORA | Vertically aligned photoreceptor/outer retinal degeneration, RPE attenuation or disruption, and increased signal transmission into the choroid. Must not qualify as cRORA. |
| cRORA | Vertically aligned zone of hypertransmission of ≥250μm, zone of attenuation or disruption of RPE band of ≥250μm, and evidence of overlying photoreceptor degeneration whose features include outer nuclear layer (ONL) thinning, external limiting membrane (ELM) loss, and ellipsoid zone (EZ) or interdigitation zone (IZ) loss. Must exclude scrolled RPE or other signs of RPE tear. |
| Exudative MNV | Pathological macular angiogenesis associated with hemorrhage, subretinal fluid, intraretinal fluid, and/or exudation. |
| Nonexudative MNV | Pathological macular angiogenesis without associated hemorrhage, subretinal fluid, intraretinal fluid, or exudation. |
| Type 1 MNV | Pathological macular angiogenesis, originating from the choriocapillaris, within the sub-RPE space. |
| Type 2 MNV | Pathological macular angiogenesis, originating from the choriocapillaris, within the subretinal space. |
| Type 3 MNV | Pathological macular angiogenesis, originating from the retinal circulation, often grows towards the RPE. |
Table 1: Courtesy of Daniel Epshtein, OD, FAAO
When imaged with OCT, fluid-associated MNV will appear as hypo-reflective subretinal or intraretinal spaces and lead to retinal thickening. Hemorrhage, lipid exudation, fibrosis, and neovascular membranes will usually appear as irregular hyper-reflective lesions and, when large enough, will also produce retinal thickening.
Figure 11 highlights OCT imaging of type 1 macular neovascularization. Note the retinal thickening, neovascular complex, exudation, and subretinal fluid.

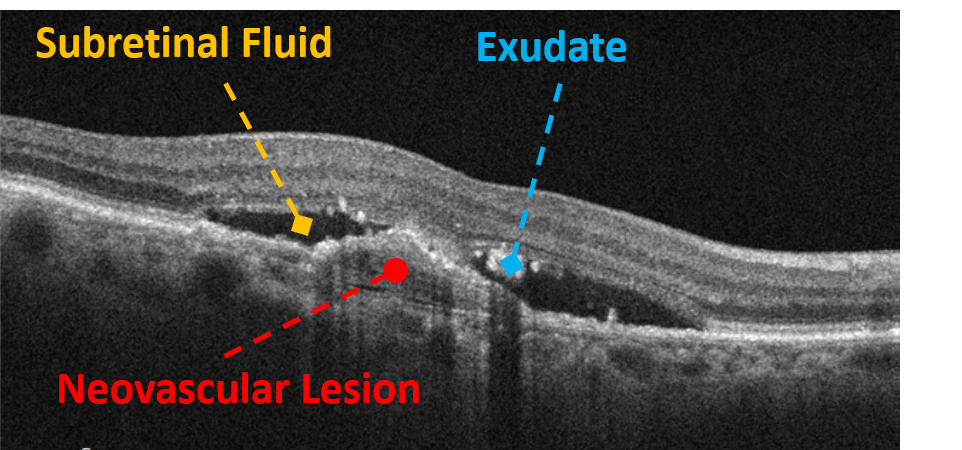
Figure 11: Courtesy of Daniel Epshtein, OD, FAAO
OCT angiography and macular neovascularization
With the emergence of OCT angiography (OCTA), a new form of neovascular AMD has been defined: nonexudative MNV. Nonexudative MNV is a subclinical neovascular lesion without fluid and minimal disruption to retinal architecture and vision.
Possibly a precursor to exudative MNV (the classic type of MNV with fluid, hemorrhage, and exudation), up to 80% of nonexudative MNV will convert to exudative disease within 2 years.9 For this reason, all cases of nonexudative MNV must be monitored carefully with serial OCT and/or OCTA imaging for the development of fluid.
Figure 12 compares two OCTA scans: exudative macular neovascularization (labeled A) and nonexudative macular neovascularization (labeled B). Note the only difference between A and B is the presence of a small pocket of subretinal fluid in the OCT scan of exudative macular neovascularization. The OCTA enface images are essentially the same.

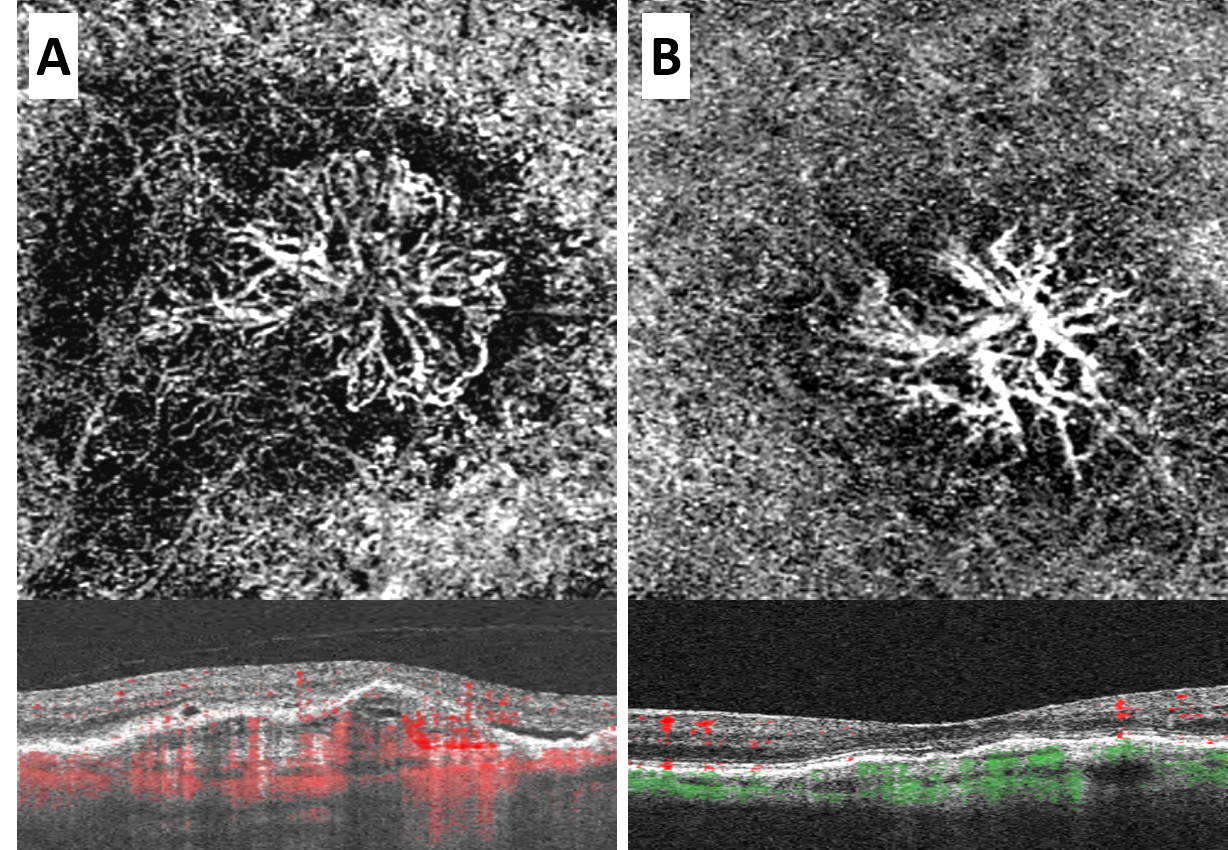
Figure 12: Courtesy of Daniel Epshtein, OD, FAAO
Using OCT to identify diabetic retinopathy
As with many of our old clinical entities, OCT has reinvented how we detect, diagnose, and manage macular edema associated with diabetes. Classically, we would look for funduscopic signs of clinically significant macular edema, but the newer terms—center-involving diabetic macular edema (CI-DME) and non-center-involving diabetic macular edema (NCI-DME), have effectively replaced all older terms.10
CI-DME is any macular edema associated with diabetes involving the central 1mm of the fovea, and NCI-DME is any macular thickening outside the central 1mm of the fovea. CI-DME and NCI-DME are easily delineated with the retinal report quantitative macular thickness map since the central ETDRS sector is 1mm in diameter. It is important to scrutinize the individual B-scans that correspond to the diabetic macular edema because retinal thickening can be caused by other etiologies such as VMT or ERMs.
Figure 13 demonstrates a retinal report and corresponding high-definition raster scan of center-involving diabetic macular edema.

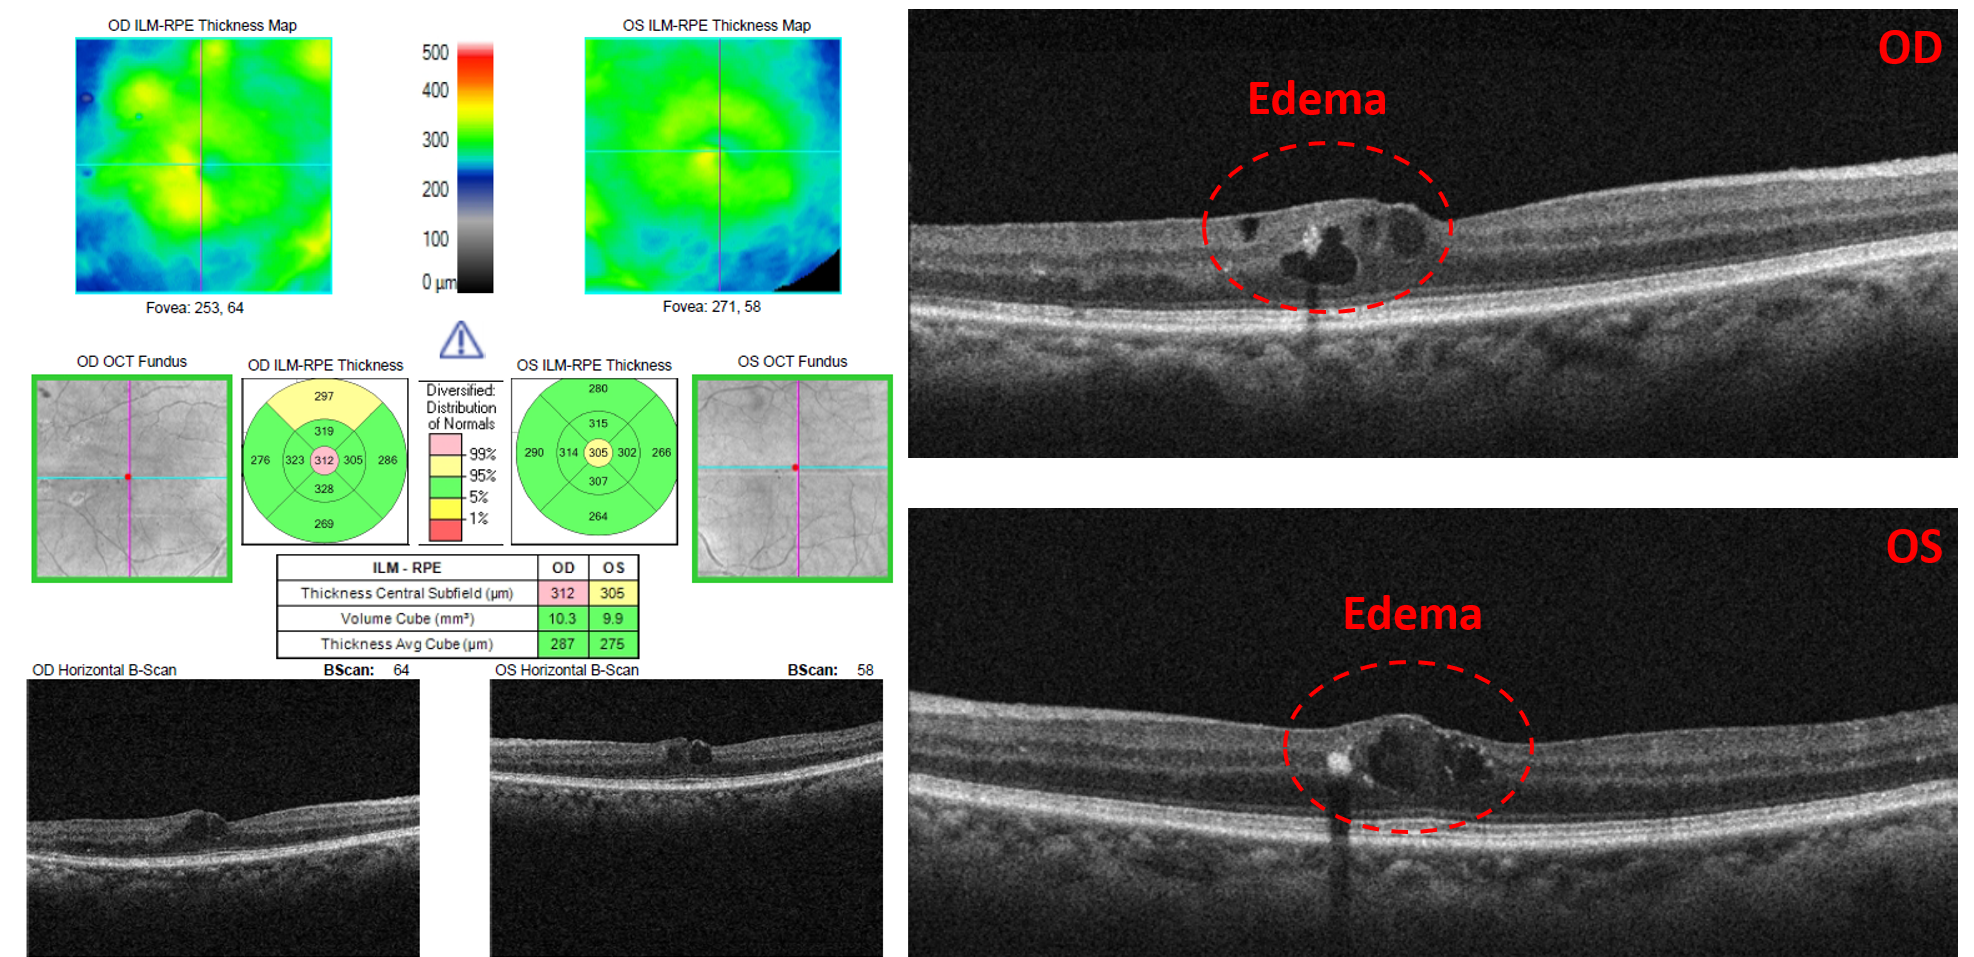
Figure 13: Courtesy of Daniel Epshtein, OD, FAAO
Hard exudates
Hard exudates are lipid products originating from the retinal vasculature and are often found in combination with diabetic macular edema. When imaged with OCT, hard exudates are seen as highly reflective lesions within or near the outer plexiform layer.
Localization to the middle retina can help distinguish hard exudates from other yellow-white lesions such as drusen or cotton wool spots. Hard exudates often produce a shadowing effect, leading to relative hypo-reflectivity of the retinal tissue below the exudate, which may mimic disruption of the outer retina.
Figure 14 is an OCT image of hard exudates creating a shadowing effect.

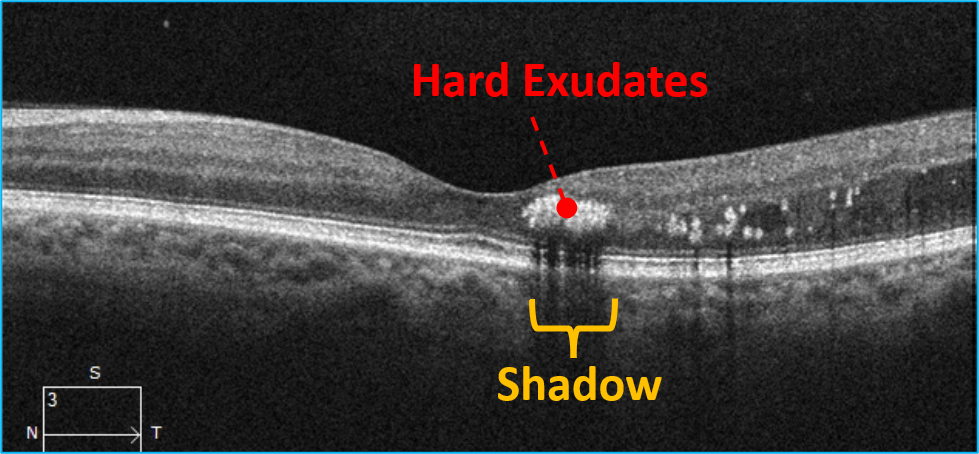
Figure 14: Courtesy of Daniel Epshtein, OD, FAAO
Cotton wool spots
Cotton wool spots are localized accumulations of axoplasmic debris presenting as superficial white indistinct retinal lesions. Cotton wool spots will appear as focal areas of retinal nerve fiber layer thickening. Localized mild retinal nerve fiber layer thinning may occur after the resolution of cotton wool spots.
Figure 15 is an OCT scan of localized retinal nerve fiber layer thickening corresponding to a cotton wool spot.

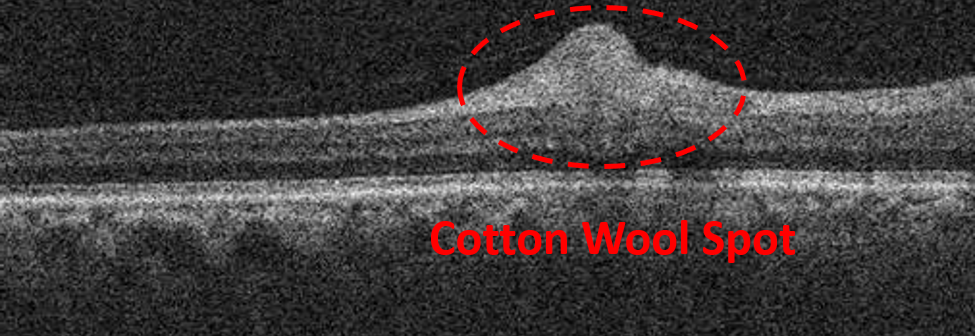
Figure 15: Courtesy of Daniel Epshtein, OD, FAAO
Using OCT to identify a choroidal nevus
Choroidal nevi are melanocytic lesions of the choroid which can vary greatly in size and pigmentation. Multimodal imaging, relying heavily on OCT, has become vital in the management of choroidal nevi. When imaged with OCT, a choroidal nevus will appear as a hypo-reflective area within the choroid.
The degree of hypo-reflectivity is related to the degree of nevus pigmentation, with a darker nevus being more hypo-reflective than a lighter-pigmented nevus. Overlying choroidal thinning, drusen, subretinal fluid, and outer retinal disruption can also be visualized with OCT.
Figure 16 is an OCT scan of a hypo-reflective area within the choroid representing a choroidal nevus. Note the overlying choroidal thinning.

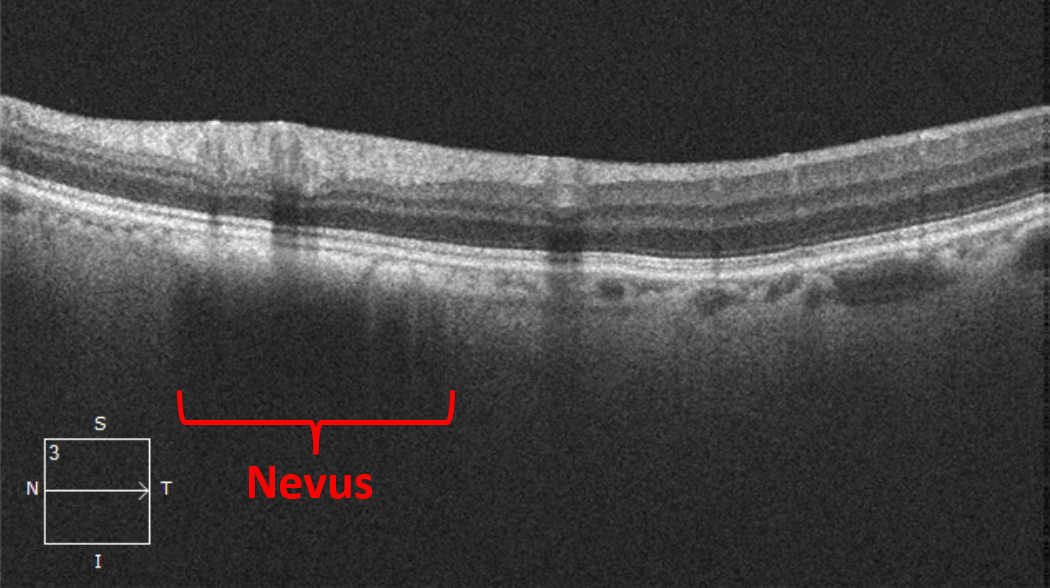
Figure 16: Courtesy of Daniel Epshtein, OD, FAAO
Using OCT to identify central serous chorioretinopathy
Central serous chorioretinopathy (CSC) most often presents as a unilateral macular serous detachment with or without a serous pigment epithelial detachment (PED). The macular serous detachment will appear as a smooth elevation of the retina overlying hypo-reflective serous fluid. If present, a PED will be noted as an elevation of the RPE with a small hypo-reflective core.
Figure 17 is an OCT scan showing central serous chorioretinopathy with hypo-reflective subretinal serous fluid.

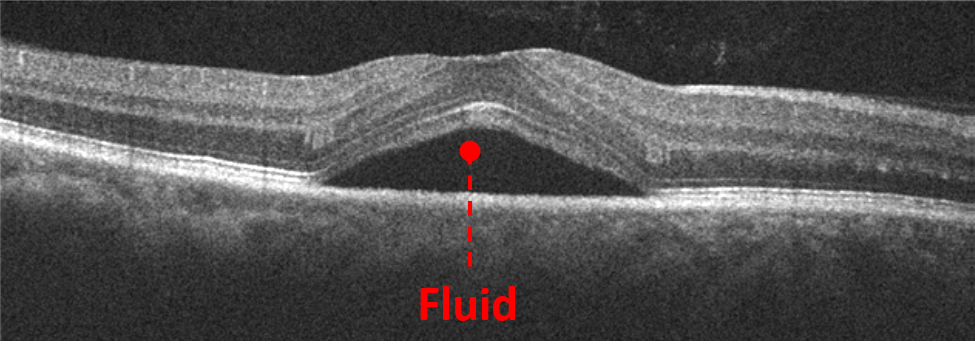
Figure 17: Courtesy of Daniel Epshtein, OD, FAAO
OCT evaluation of CSC has become increasingly important because many of the new diagnostic criteria for CSC center on OCT findings (see Table 2). In addition to evaluating for serous retinal and pigment epithelial detachment, RPE disturbances and choroidal thickness can be measured with OCT as well.
There has been a shift to evaluating the choroid in CSC due to the discovery that many CSC patients have a thickened choroid. Choroidal thickness varies greatly throughout the population based on axial length, age, and sex, but generally, any subfoveal choroidal thickness greater than 350 to 400µm is considered a thick choroid.
The CSC International Group Criteria for CSC Diagnosis:
Major criteria (must fulfill both)
- Presence or evidence of prior serous retinal detachment documented on OCT involving the posterior pole unrelated to other diseases.11
- At least 1 area of RPE alteration on fundus autofluorescence, OCT, or infrared imaging.11
Minor Criteria (must fulfill at least one)
- Mid-phase hyperfluorescence placoid areas on indocyanine green angiography.11
- One or more focal leaks on fluorescein angiography.11
- Subfoveal choroidal thickness ≥400µm (consider age and axial length).11
Conclusion
OCT has been a transformative force in the diagnosis and management of retinal disease. This technology continues to evolve, entrenching itself further in the eyecare practitioner’s armamentarium and allowing us to provide the highest level of care to all our patients.
