


Corneal topography is an essential tool in evaluating a patient for refractive surgery. For corneal refractive surgery, including laser-assisted in situ keratomileusis (LASIK), photorefractive keratectomy (PRK), and small incision lenticule extraction (SMILE), topography is used to screen candidates for corneal abnormalities that may put the patient at risk for postoperative complications.
Cataract surgery also requires accurate corneal topography for proper IOL power calculations and to predict postoperative astigmatism. Corneal topographers in practice today rely on one of two principles—Placido disk imaging (topography) or Scheimpflug imaging (tomography). This article will be focusing on Scheimpflug imaging.
Scheimpflug-based corneal tomographers utilize a rotating camera that allows 3D imaging of the entire cornea, as well as the anterior chamber, iridocorneal angle, iris, and lens. Scheimpflug-based imagers’ primary benefit over Placido disk imagers is that they provide elevation maps rather than curvature maps.
Elevation maps allow the clinician to analyze the true shape of the corneal surface rather than infer it from curvature maps. In addition, Scheimpflug tomography can image both the anterior and posterior surface of the cornea, with the benefit of acquiring optical pachymetry values covering the entire cornea.
Scheimpflug devices
There are multiple devices on the market that utilize Scheimpflug imaging technology. A commonly used device is the Pentacam (Oculus USA, Arlington, WA). There are several models of the Pentacam, but all share the same basic characteristics: a Scheimpflug camera for anterior segment imaging and software that analyzes the cornea for keratoconus (of varying stages from suspect to forme fruste to severe), Pellucid Marginal Degeneration (PMD), and ectasia along with progression analysis models. Other models include basic to advanced software for measuring axial length, optical biometry, wavefront aberrometry for cataract surgery, and much more.
Several Scheimpflug devices on the market include Placido disc imaging and a Scheimpflug camera. This includes the Galilei ColorZ (Ziemer Ophthalmic Systems, Port, Switzerland),1 the VX130 by Visionix (formerly Luneau Technology and Optovue, Chartres, France),2 and the Sirius+ by SCHWIND (SCHWIND eye-tech-solutions, Kleinostheim, Germany).3
The Pentacam: my clinical experience
At my office, we use the Pentacam as our primary corneal topographer. The Pentacam produces a large amount of data per scan. We typically use two displays for our evaluations—4 Maps Selectable and the Belin-Ambrósio Enhanced Ectasia Display (BAD). The 4 Maps Selectable displays anterior curvature, anterior elevation, posterior elevation, and pachymetry.
The elevation maps are generated by comparing the corneal surface to a “best fit sphere.” Areas that lie above or below the reference sphere are indicated in shades of blue or red, respectively. Elevation maps are useful in identifying areas of focal elevation, as would be seen in keratoconus or post-refractive ectasia. The BAD analyzes the rate of pachymetric change from the thinnest part of the cornea to the limbus.
“The paradigm underlying the BAD is that ectatic corneas have a faster rate of pachymetric change as one moves from the thinnest point of the cornea out to the periphery.”
In other words, they thicken faster from the center to the periphery. By comparing the patient’s pachymetry profile to a normalized database, the BAD can identify corneas that may be at higher risk of postoperative ectasia
Case examples using the Pentacam*
Case 1
Figure 1 shows a normal cornea of the right eye as measured by the Pentacam.

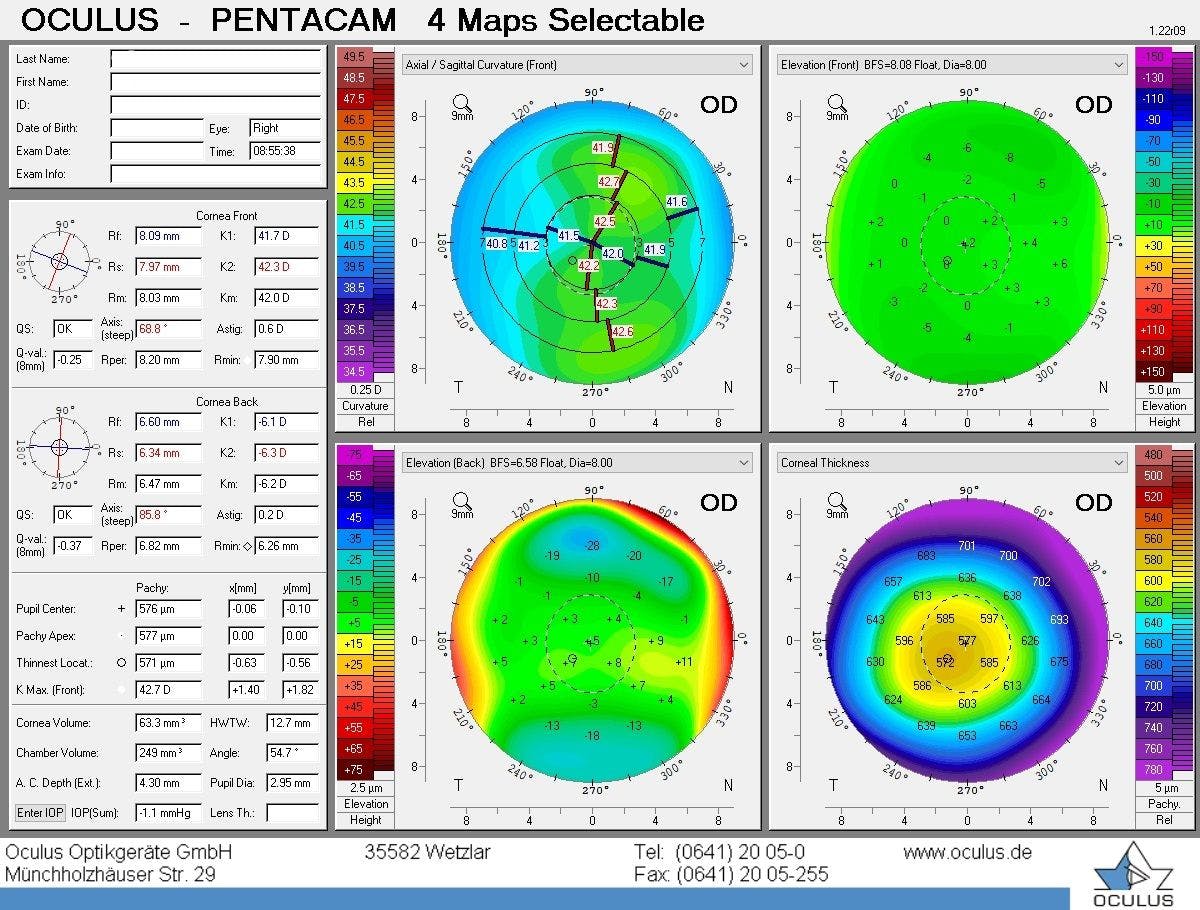
Figure 1: Image provided courtesy of Oculus.
The upper left map is the anterior curvature map, showing approximately 0.6D of regular astigmatism. This is similar to the curvature map seen on a Placido disk-based topographer. The upper right map is the anterior elevation map. The entire map is green, indicating that there are no areas of focal elevation.
The lower left map shows a posterior elevation map. There are two areas of bluish-green, indicating some mild elevation in the superior and inferior cornea, but this is considered normal. The lower right map is the pachymetry map, which shows pachymetry values across the entire cornea. We can see that the thinnest part of the cornea is slightly inferior to the corneal center, but there are no signs of ectasia.
Case 1 Belin-Ambrósio Enhanced Ectasia Display
Figure 2 demonstrates the BAD for the normal cornea of the right eye in Figure 1.
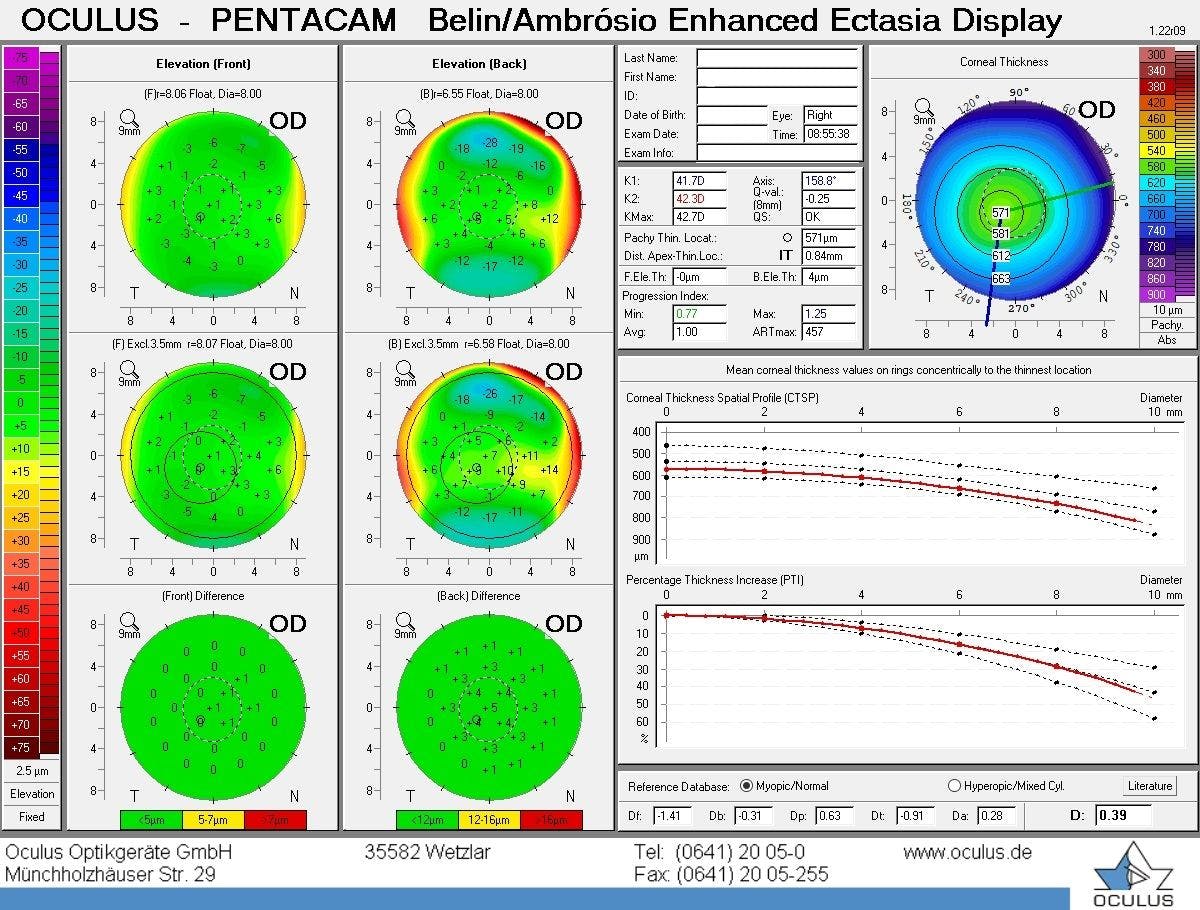
Figure 2: Image provided courtesy of Oculus.
On the left side of the display are two columns representing an analysis of the anterior elevation map (left column) and the posterior elevation map (right column). The top and middle maps are comparing the measured cornea to a “Best Fit Sphere (BFS)” and an “Enhanced Best Fit Sphere (EBFS),” respectively. The bottom display is the color-coded “Difference” map which indicates whether the difference between the BFS map and the EBFS map is clinically significant. In this case, both difference maps are green, indicating a low risk for ectasia.
On the right side of the BAD are two graphs representing pachymetry analysis. As mentioned earlier, the software analyzes the measured corneal pachymetry and compares it to a normalized database. The resultant data is plotted in two graphs—the Corneal Thickness Spatial Profile (CTSP) and the Percent Thickness Increase (PTI).
“The CTSP examines the change in corneal thickness as one moves from the thinnest point to the peripheral cornea.”
The dotted lines indicate the 95% confidence interval of normal corneas, and the red line indicates the measured cornea. Below the CTSP is the PTI, which examines the change in thickness as a percentage. Again, the dotted lines indicate the 95% confidence interval, and the red line is the measured cornea. As we can see, this cornea’s pachymetry profile fits within the 95% confidence interval and is considered normal.
Along the bottom of the screen is a series of “D” numbers that have been calculated from the measured cornea. These numbers represent standard deviations from the mean for five different measured parameters. These parameters are Df (front elevation), Db (posterior elevation), Dp (pachymetry progression), Dt (thinnest point), and Da (thinnest displacement). The individual values can be flagged yellow for borderline or red for abnormal; however, they are not considered predictive for ectasia on their own.
The final value, “D” (on the far right in bold print), is derived from considering all five parameters and performing a linear regression analysis against a reference database. This value is predictive for ectasia and is color-coded for easy analysis. White indicates the value is less than 1.6 standard deviations from the mean, yellow is between 1.6 and 2.6 standard deviations, and red is 2.6 or more standard deviations.
Any corneas with a yellow or red flag should warn the clinician that this patient may be at risk for ectasia.
Case 3
Figure 3 illustrates a seemingly normal cornea of the right eye with an unremarkable anterior curvature map.
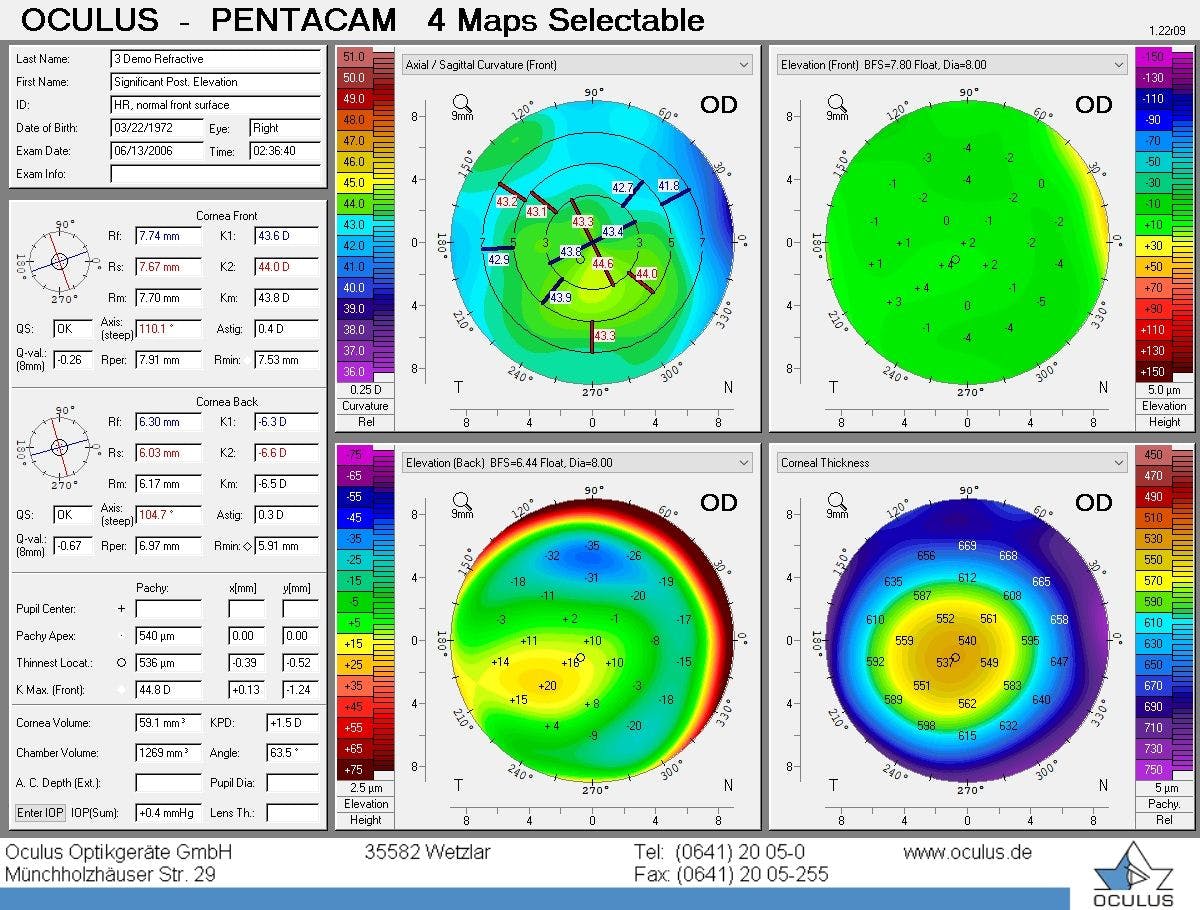
Figure 3: Image provided courtesy of Oculus.
The data appears to display no evidence of irregular astigmatism or inferior steepening. However, the posterior elevation map (bottom left) reveals a focal area of inferior paracentral elevation. This cornea has subclinical keratoconus, which places this patient at risk for ectasia.
Case 4
Figure 4 exhibits a posterior elevation map that was flagged as abnormal, with the final “D” value flagged yellow with a noted flattening at the periphery of both the CTSP and PTI plots.
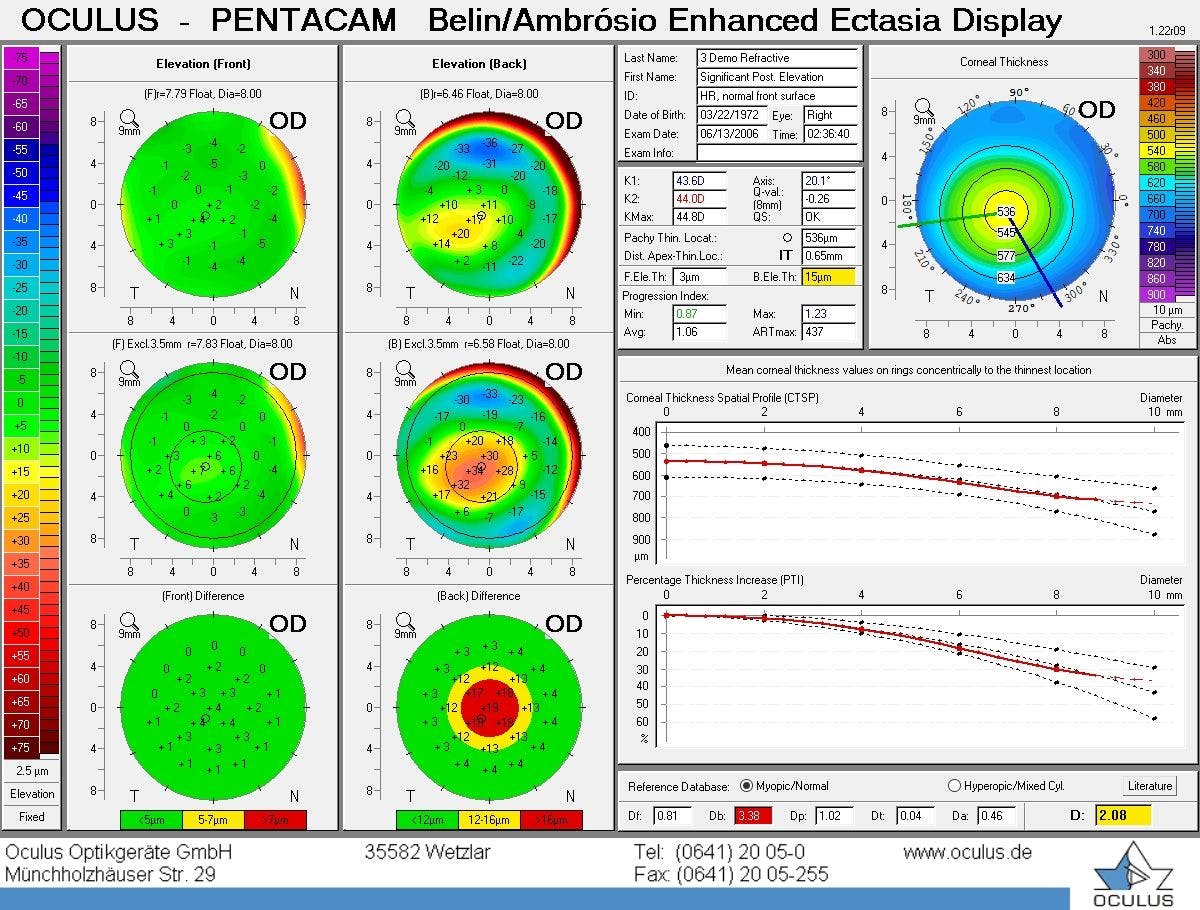
Figure 4: Image provided courtesy of Oculus.
All of these findings indicate that this patient might be at greater risk of ectasia, meaning corneal refractive surgery may need to be reconsidered for this case.
Case 5
Figure 5 shows a cornea of the right eye with keratoconus exhibiting significant steepening on the anterior curvature map.
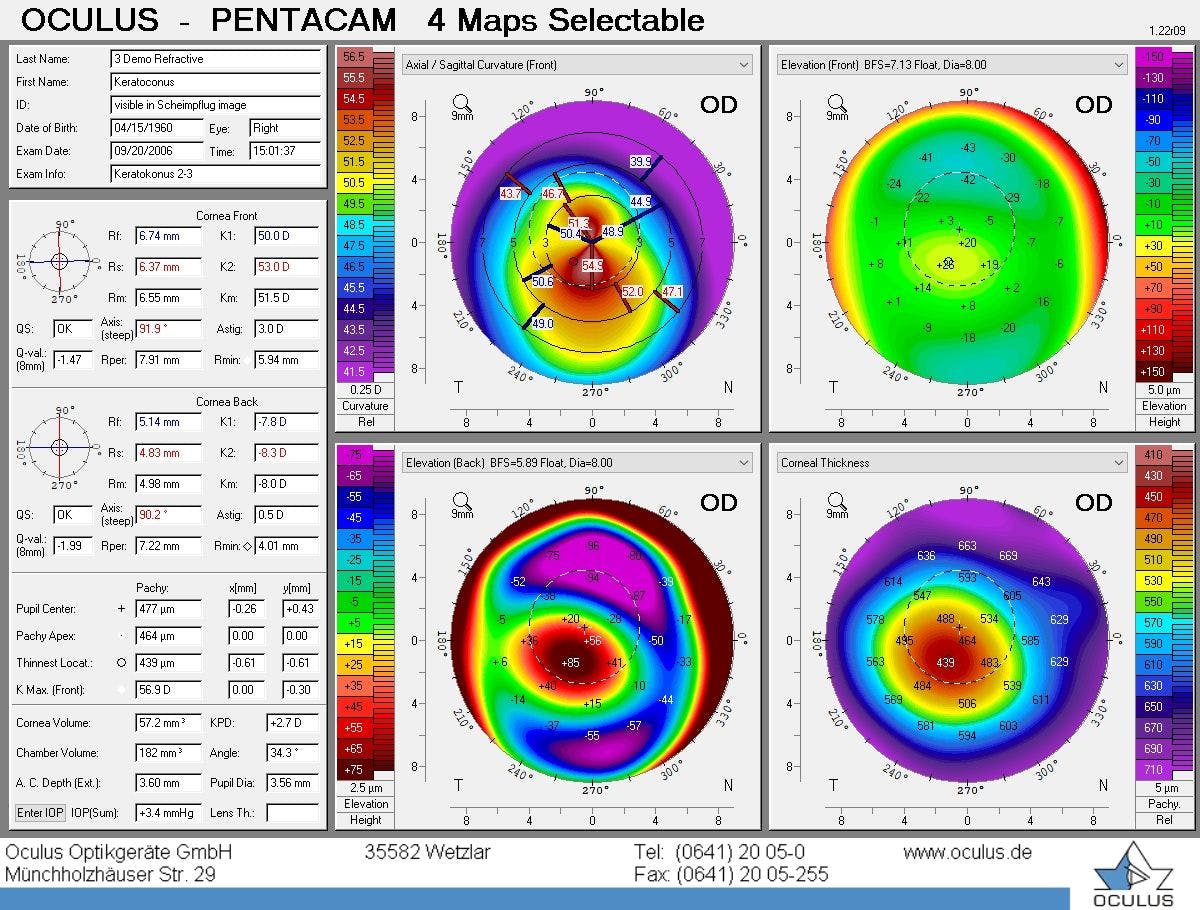
Figure 5: Image provided courtesy of Oculus.
Furthermore, the pachymetric map shows significant thinning inferior to the corneal center. The posterior elevation map shows a focal area of significant elevation with a corresponding small area of elevation on the anterior elevation map. All of these findings are clear signs of ectasia and are contraindications to corneal refractive surgery.
The future of Scheimpflug imaging
Recently, the analysis of corneal biomechanics is being used as a predictive model to assess the risk of corneal ectasia. The current theory is that the cornea becomes biomechanically weak, followed by structural changes. A new device, the Corvis ST (Oculus USA, Arlington, WA), utilizes a Scheimplfug camera and a non-contact tonometer to measure and analyze corneal morphology and biomechanics.4
Using an air puff, the tonometer indents the cornea, and the Scheimpflug camera analyzes the resultant movement of the cornea. The software analyzes this data and compares it to a normalized database. This represents the next evolutionary step in the early detection of corneal ectasia beyond the Belin-Ambrósio Enhanced Ectasia Display.
Taking this concept a bit further, a new application for analyzing corneal biomechanics is the detection of corneal ectasia after corneal refractive surgery.
“Previous analytical paradigms (such as the BAD) were designed to analyze preoperative corneas—any postoperative cornea (normal or abnormal) will always appear abnormal on the BAD. ”
This limits the usefulness of the BAD for detecting early postoperative ectasia. A new algorithm has been developed for the Corvis ST called the Combined Biomechanical Index-Laser Vision Correction (CBI-LVC).5 The chief purpose is to detect early postoperative corneal ectasia before significant progression has occurred.
Integrating Scheimpflug imaging into your workflow
Integrating Scheimpflug imaging into your workflow is easy. In my clinical experience, devices like the Pentacam, Galilei, VX130, or Sirius+ are no more difficult to operate than a traditional corneal topographer. The protocol in our practice mandates all LASIK candidates have their corneas imaged by the Pentacam before the doctor sees the patient.
If the Pentacam reveals that the patient is at risk of ectasia, then the doctor counsels the patient that corneal refractive surgery is likely not a good option. These patients will be monitored for progression with serial Pentacam scans and examinations.
Billing
Scheimpflug-based tomography can be billed using CPT 92025, “computerized corneal topography, unilateral or bilateral, with interpretation and report.” Our practice tends to only bill this particular code.
There are additional codes that could be billed, including 92132, “optical tomography of the anterior segment,” and 92185, “external ophthalmic photography.” More advanced imaging systems might include billable activity for biometry and wavefront analysis (under the refraction code).
While you might be inclined to bill these tests together, Medicare has a limiting policy called Multiple Procedure Payment Reduction (MPPR).6 When more than one test is performed on the same day, it reduces the allowable bill rate for the technical component of the lesser-valued test.
Since these devices can provide optical pachymetry measurements, the question arises as to whether we can bill for pachymetry using the CPT code 76514, “ophthalmic ultrasound, diagnostic; corneal pachymetry, unilateral or bilateral (determination of corneal thickness).” This code technically covers ultrasound pachymetry, not optical pachymetry as provided by a corneal tomographer or OCT.
The Centers for Medicare and Medicaid Services (CMS) Medicare Coverage Database states that CPT code 92499, “unlisted ophthalmological service or procedure,” could be used for Scheimpflug-based pachymetry.7 If there is a question on whether the test might not be covered, it is prudent to use an Advanced Beneficiary Notice (ABN) where Medicare Part B coverage is ambiguous or not covered. For commercial patients, the equivalent of this documentation is a Notice of Exclusion from Health Plan Benefits (NEHB).
Conclusion
Scheimpflug imaging has many benefits in the evaluation of refractive surgery candidates. It can image the posterior cornea, which can allow for the detection of early to subclinical keratoconus, along with the added benefit of providing optical pachymetry measurements over the entire cornea surface.
While Placido disc-based systems can provide highly accurate curvature measurements, they are dependent on tear film quality and are unable to analyze the peripheral cornea. For these reasons, integrating Scheimpflug-based imaging into your refractive surgery practice is a straightforward way to uncover the risks associated with pre- and postoperative corneal ectasia, keratoconus, and PMD.
*All Pentacam scans were provided courtesy of Oculus.
