Published in Retina

The Pathogenesis of Geographic Atrophy: An Animated Journey

This content is an independent editorial sponsored by Astellas. Astellas had no input in the development of this content.

9 min read

This article outlines the pathogenesis of geographic atrophy (GA), with detailed animations illustrating the complement system and GA progression.

The Pathogenesis of Geographic Atrophy: An Animated Journey
Geographic atrophy (GA) secondary to age-related macular degeneration (AMD) can be considered a chronic progressive neurodegenerative retinal disease involving the loss of photoreceptor cells and supportive retinal pigmented epithelial cells (RPE).1
It is evident that GA potentially affects approximately 8 million people worldwide and is a rising cause of blindness in the developed world, specifically within the Caucasian population compared to other ethnicities.2,3

The "why" of geographic atrophy

The outstanding questions have been: how does this condition evolve, and where does it start? We begin by looking at the complement system implicated in GA via human genetics, retinal pathology, genomic and proteomic analyses of human tissues, and work in numerous animal models.4-12 The true identity lies within the details of complement activation in the disease—classical, lectin, and alternative pathways.
This article sets out to help you interactively understand the complement pathway through biochemical models, clinical time-lapse fundus photography, fundus autofluorescence imaging studies, and finally, an appreciation of the visual impact of GA if left untreated.

The complement system

The complement cascade involves many protein interactions that occur within the plasma, on cell surfaces, and within cells.13 The cascade begins with three pathways: classical, lectin, and alternative. Each pathway converges on C3.14 Then C3 mediates multiple functions and eventually cleaves C5, which forms the terminal lytic pathway building up to the membrane attack complex (MAC).15,16
Of note, the alternative pathway (AP) is the oldest evolutionary signaling pathway of the three. The alternative complement pathway acts both independently of, and as an amplification loop for, the classical and lectin pathways.17 Shown in the diagram in regard to the AP amplification loop are key components of the C3 pathway, including C3 fragments, the complement receptors, and associated functions.
This portion of the illustration is meant to appreciate the myriad of different interactions between C3 fragments and their receptors on a generic cellular scaffold, which indirectly causes cell lysis leading to photoreceptor dropout, vision loss, and the formation of GA.14
The anaphylatoxins (C3a and C5a), their receptors, and associated functions activate and further heighten inflammation within the choriocapillaris/BM/RPE interface. The remainder of the Lytic pathway is played out in the final stage, as shown with these steps culminating with the MAC.14

The complement cascade

When RPE cells are exposed to healthy Bruch’s membrane (BM) and carry the CFH 402Y polymorphism in quiescent conditions, glucose is transported efficiently from the choroid/choriocapillaris (CC) through BM to the photoreceptors (PR) coupled with phagocyte photoreceptor outer segments (POS), and finally the elimination of oxidized lipids (OX) into the circulation. Integrins act as anchors between the RPE cells and BM, while FI and cofactors FH and FHL1 inhibit complement activation, and mitochondria respiration (OXPHOS = oxidative phosphorylation) is left intact.
AMD predisposition can be facilitated by the combination of genetic risk,18 increasing age, and external risk factors (i.e., smoking, obesity, etc.).19,20 When RPE cells carrying the AMD-associated FH 402H polymorphism show mitochondrial dysfunction, while phagolysosomes (L) become edematous reflexively, causing “leaky” integrin interactions between the BM and RPE.21,22 With these risk factors in mind, the BM extracellular matrix (ECM) illustrates modeling changes with apparent glucose transport impairment.
At this stage, complement turnover is stimulated by aberrant ECM and a lack of effective inhibition due to the presence of high-risk variants in FI, FH, FHL1, and the accumulation of FH antagonists, such as the FHR proteins.23,24 Complement turnover promulgates proinflammatory products to accumulate in the intercapillary septa and within BM itself.
Additionally, as mitochondrial oxidative stress boils over, it causes metabolic stress in the RPE cells, which can further stimulate inflammation.25 Hydrogen peroxide (H2O2) and products of lipid peroxidation engorge the already altered BM, promoting the upregulation of inflammatory cytokines and the high-risk CFH 402H variant with FHR accumulation amplifying this effect.26
Switching gears to early AMD, there is a continuous accumulation of oxidized lipids. Subsequently, complement activation products and MAC accumulation in drusen further promote an inflammatory response and immunological chain reaction. Localized inflammation, in conjunction with the release of anaphylatoxins C3a and C5a, causes the recruitment and activation of immune cells and mast cell degranulation into the choroid/BM/RPE interface.27
These inflammatory activities incrementally aggravate retina homeostasis, initiating RPE cell degeneration and the inability to support rod photoreceptor cells, which leads to retinal tissue damage and eventual morbidity.28

Complement activation from start to finish in geographic atrophy

When observing increased complement protein access to the outer neuroretinal space, it can be rooted back to the loss of RPE barrier function and damage to Bruch’s membrane.28,29 Further, reduced expression of membrane regulators of complement activation incites the complement attack on RPE cells and photoreceptors in the central foveal lesion and perifoveal border(s).
Subsequently, the generation of complement anaphylatoxins C3a, C4a, and C5a at the choroid/BM/RPE interface leads to C3 and C4 opsonization and formation of the MAC.14,27 Combining these complement activities together with an increased presence of phagocytic cells (macrophages and neutrophils) and mast cells at the interface promotes further loss of photoreceptors and RPE.27,30

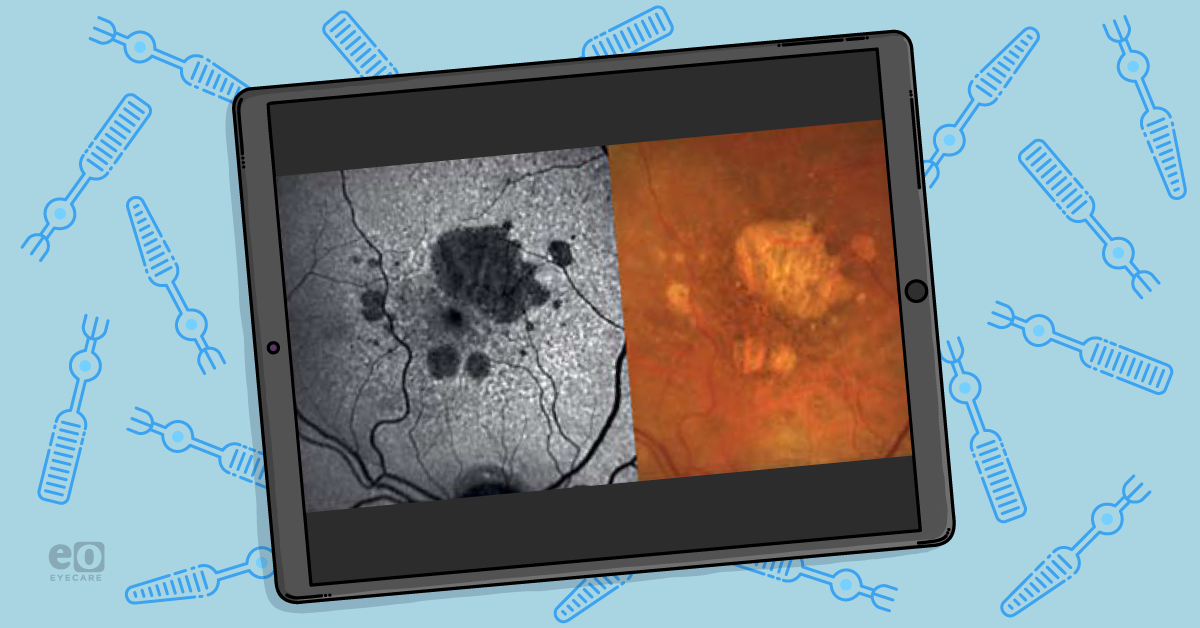
Here we see the development and progression of atrophy in purely nonexudative age-related macular degeneration with annual retinal imaging during 4-year follow-up from baseline.

The first row is a set of color fundus photographs (CFP), while the second row is confocal scanning laser ophthalmoscopy (CSLO) using blue-light fundus autofluorescence (FAF) for image capture.

FAF demonstrates areas of hyper-autofluorescence and hypo-autofluorescence. The photoreceptors shed damaged outer-segments, which are then ingested through phagocytosis by the RPE.

These molecules are stored in liposomes and form lipofuscin (LF). Areas of excess LF will demonstrate hyper-autofluorescence. This is also known as areas of “damaged” RPE cells.

However, upon RPE cell death or absence (atrophy), the LF disappears, and the tissue becomes hypofluorescent. Areas of GA with a hyperautofluorescence rim might be suggestive of faster GA lesion progression.31,32

As geographic atrophy is typically initiated outside of the foveal area, decreasing the rate of insulted GA area by 25% to 50% can potentially delay progression to the fovea by years.6 This is why early intervention is paramount for these patients to retain long-term vision.

Understanding the progression of GA

Flipping to an illustrative approach of GA area growth over time, the dotted circles in the image adjacent to the graph represent expected GA growth per expected natural history (red) or with reduced speed of progression (blue, green).
It is evident from the literature that the rate of geographic atrophy progression could be more rapid by approximately 2.8 times toward the periphery than toward the fovea.6,33 In addition, multifocal atrophic lesions progress at a faster rate than unifocal lesions. Larger geographic atrophy lesions grow quicker than smaller atrophic lesions.
GA lesions can significantly affect patient vision. Central vision is largely preserved until atrophy encroaches on the fovea, though tasks requiring full-field vision, such as reading/writing, digital screens, driving, sewing, etc., can be impaired as peripheral vision is lost.
Of note, geographic atrophy often presents as functional vision loss before Snellen visual acuity will be lost.

Conclusion

As we begin to appreciate the nuances of the complement cascade, the identification of strategic targets for GA therapy will continue to emerge from research centering around natural history and genetics.
Furthermore, it is crucial to expand the understanding of GA pathophysiology in order to understand the contributing factors that could lead to subsequent visual function decline. With increased knowledge and novel therapeutics, we can potentially offer these GA patients hope for sight preservation.
  1. Fleckenstein M, Mitchell P, Freund KB, et al. The progression of geographic atrophy secondary to age-related macular degeneration. Ophthalmology. 2018;125(3):369-390. doi: 10.1016/j.ophtha.2017.08.038.
  2. Nielson MK, Shah YS, Do DV, et al. Geographic Atrophy. EyeWiki (American Academy of Ophthalmology). Published December 19, 2021. Accessed April 25, 2023. https://eyewiki.aao.org/Geographic_Atrophy.
  3. Wong WL, Su X, Li X, et al. Global prevalence of age-related macular degeneration and disease burden projection for 2020 and 2040: a systematic review and meta-analysis. Lancet Glob Health. Lancet Glob Health. 2014;2(2):e106-e116. doi: 10.1016/S2214-109X(13)70145-1.
  4. Fritsche LG, Igl W, Bailey JNC, et al. A large genome-wide association study of age-related macular degeneration highlights contributions of rare and common variants. Nat Genet. 2016;48(2):134-143. doi: 10.1038/ng.3448.
  5. Tan PL, Bowes Rickman C, Katsanis N. AMD and the alternative complement pathway: genetics and functional implications. Hum Genomics. 2016;10(1):23. doi: 10.1186/s40246-016-0079-x.
  6. Boyer DS, Schmidt-Erfurth U, Van Lookeren CM, et al. The pathophysiology of geographic atrophy secondary to age-related macular degeneration and the complement pathway as a therapeutic target. Retina. 2017;37(5):819-835. doi: 10.1097/IAE.0000000000001392.
  7. Katschke KJ, Jr, Xi H, Cox C, et al. Classical and alternative complement activation on photoreceptor outer segments drives monocyte-dependent retinal atrophy. [published correction appears in Sci Rep. 2018 Aug 24;8(1):13055]. Sci Rep. 2018;8(1):7348. doi: 10.1038/s41598-018-25557-8.
  8. Bennis A, Gorgels TGMF, ten Brink JB, et al. Comparison of mouse and human retinal pigment epithelium gene expression profiles: potential implications for age-related macular degeneration. PLoS ONE. 2015;10(10):e0141597. doi: 10.1371/journal.pone.0141597.
  9. Hageman GS, Mullins RF. Molecular composition of drusen as related to substructural phenotype. Mol Vis. 1999;5:28.
  10. Mullins RF, Faidley EA, Daggett HT, et al. Localization of complement 1 inhibitor (C1INH/SERPING1) in human eyes with age-related macular degeneration. Exp Eye Res. 2009;89(5):767-773. doi: 10.1016/j.exer.2009.07.001.
  11. Schäfer N, Grosche A, Schmitt SI, et al. Complement components showed a time-dependent local expression pattern in constant and acute white light-induced photoreceptor damage. Front Mol Neurosci. 2017;10:197. doi: 10.3389/fnmol.2017.00197.
  12. Jiao H, Rutar M, Fernando N, et al. Subretinal macrophages produce classical complement activator C1q leading to the progression of focal retinal degeneration. Mol Neurodegener. 2018;13(1):45. doi: 10.1186/s13024-018-0278-0.
  13. Heesterbeek TJ, Lechanteur YTE, Lorés-Motta L, et al. Complement activation levels are related to disease stage in AMD. Invest Ophthalmol Vis Sci. 2020;61(3):18. doi:10.1167/iovs.61.3.18.
  14. Janeway CA Jr, Travers P, Walport M, et al. Immunobiology: The Immune System in Health and Disease. 5th edition. New York: Garland Science; 2001. The complement system and innate immunity.
  15. Scholl HP, Fleckenstein M, Fritsche LG, et al. CFH, C3 and ARMS2 are significant risk loci for susceptibility but not for disease progression of geographic atrophy due to AMD. PloS one. 2009;4(10)::e7418. doi:10.1371/journal.pone.0007418.
  16. Skeie JM, Fingert JH, Russell SR, et al. Complement component C5a activates ICAM-1 expression on human choroidal endothelial cells. Invest Ophthalmol Vis Sci. 2010;51(10):5336-5342. doi:10.1167/iovs.10-5322.
  17. Lachmann PJ. The amplification loop of the complement pathways. Adv Immunol. 2009;104:115-149. doi:10.1016/S0065-2776(08)04004-2.
  18. Schramm EC, Clark SJ, Triebwasser MP, et al. Genetic variants in the complement system predisposing to age-related macular degeneration: a review. Mol Immunol. 2014;61(2):118-125. doi:10.1016/j.molimm.2014.06.032.
  19. Priya RR, Chew EY, Swaroop A. Genetic studies of age-related macular degeneration: lessons, challenges, and opportunities for disease management. Ophthalmology. 2012;119(12):2526-2536. doi:10.1016/j.ophtha.2012.06.042.
  20. Ajana S, Cougnard-Grégoire A, Colijn JM, et al. Predicting Progression to Advanced Age-Related Macular Degeneration from Clinical, Genetic, and Lifestyle Factors Using Machine Learning. Ophthalmology. 2021;128(4):587-597. doi:10.1016/j.ophtha.2020.08.031.
  21. Keenan TD, Toso M, Pappas C, et al. Assessment of Proteins Associated With Complement Activation and Inflammation in Maculae of Human Donors Homozygous Risk at Chromosome 1 CFH-to-F13B. Invest Ophthalmol Vis Sci. 2015;56(8):4870-4879. doi:10.1167/iovs.15-17009.
  22. Clark SJ, Schmidt CQ, White AM, et al. Identification of factor H-like protein 1 as the predominant complement regulator in Bruch's membrane: implications for age-related macular degeneration. J Immunol. 2014;193(10):4962-4970. doi:10.4049/jimmunol.1401613.
  23. Rodríguez de Córdoba S, Díaz-Guillén MA, Heine-Suñer D. An integrated map of the human regulator of complement activation (RCA) gene cluster on 1q32. Mol Immunol. 1999;36(13-14):803-808. doi:10.1016/s0161-5890(99)00100-5.
  24. Cserhalmi M, Papp A, Brandus B, et al. Regulation of regulators: Role of the complement factor H-related proteins. Semin Immunol. 2019;45:101341. doi:10.1016/j.smim.2019.101341.
  25. Brown EE, DeWeerd AJ, Ildefonso CJ, et al. Mitochondrial oxidative stress in the retinal pigment epithelium (RPE) led to metabolic dysfunction in both the RPE and retinal photoreceptors. Redox Biol. 2019;24:101201. doi:10.1016/j.redox.2019.101201.
  26. Armento A, Honisch S, Panagiotakopoulou V, et al. Loss of Complement Factor H impairs antioxidant capacity and energy metabolism of human RPE cells. Sci Rep. 2020;10(1):10320. doi:10.1038/s41598-020-67292-z.
  27. Klos A, Tenner AJ, Johswich KO, et al. The role of the anaphylatoxins in health and disease. Mol Immunol. 2009;46(14):2753-2766. doi:10.1016/j.molimm.2009.04.027.
  28. Armento A, Ueffing M, Clark SJ. The complement system in age-related macular degeneration. Cell Mol Life Sci. 2021;78(10):4487-4505. doi:10.1007/s00018-021-03796-9.
  29. Whitmore SS, Sohn EH, Chirco KR, et al. Complement activation and choriocapillaris loss in early AMD: implications for pathophysiology and therapy. Prog Retin Eye Res. 2015;45:1-29. doi:10.1016/j.preteyeres.2014.11.005.
  30. Wang JC, Cao S, Wang A, et al. CFH Y402H polymorphism is associated with elevated vitreal GM-CSF and choroidal macrophages in the postmortem human eye. Mol Vis. 2015;21:264-272.
  31. Holz FG, Bellman C, Staudt S, et al. Fundus autofluorescence and development of geographic atrophy in age-related macular degeneration. Invest Ophthalmol Vis Sci. 2001;42(5):1051-1056.
  32. Holz FG, Bindewald-Wittich A, Fleckenstein M, et al. Progression of geographic atrophy and impact of fundus autofluorescence patterns in age-related macular degeneration. Am J Ophthalmol. 2007;143(3):463-472.
  33. Lindner M, Böker A, Mauschitz MM, et al. Directional Kinetics of Geographic Atrophy Progression in Age-Related Macular Degeneration with Foveal Sparing. Ophthalmology. 2015;122(7):1356-1365. doi:10.1016/j.ophtha.2015.03.027.
Mary Beth Yackey, OD
About Mary Beth Yackey, OD

Mary Beth Yackey, OD, joined Cincinnati Eye Institute (CEI) in 2004. Dr. Yackey is a national board-certified provider of Optometric Services and a member of the Vitreoretinal team. Her practice emphasizes eye diseases such as macular degeneration, diabetic retinopathy, vascular diseases of the retina, and urgent eye care.

She also enjoys co-managing pre- and post-operative patients. Her practice includes teaching students, residents, and fellows in-clinic. In her practice, Dr. Yackey participates in studies involving the Vitreo-Retinal space. Dr. Yackey received her Bachelor of Science degree from The Ohio State University and her Doctor of Optometry from New England College of Optometry.

Dr. Yackey is an active member of The Board of Trustees for the Cincinnati Optometric Association. She is also a member of the American Optometric Association. In addition, Dr. Yackey serves as a member of the Board of Trustees for Clovernook Center for the Blind and Visually Impaired and a Medical Chair for the Foundation Fighting Blindness Cincinnati/Northern Kentucky Vision Walk.

Mary Beth Yackey, OD
Eyes On Eyecare Site Sponsors
Astellas LogoOptilight by Lumenis Logo