


Visual field (VF) testing is a fundamental component of eyecare and is recommended for all patients with elevated intraocular pressure (IOP) or suspicious optic nerve findings.
In glaucoma management, the standard of care is automated static threshold perimetry, with frequent visual fields obtained within the first 2 years of follow‑up to establish disease severity and determine each patient’s rate of progression.
Interpreting visual fields is both an art and a science. Although the subjective nature of testing can introduce artifacts and reliability issues related to patient cooperation, a systematic, step‑by‑step approach allows clinicians to confidently interpret visual fields and apply them effectively in glaucoma management.
The importance of baseline visual fields
Baseline visual fields are critical in glaucoma management because they serve as the reference for detecting future change. To ensure accuracy, a minimum of two baseline fields—typically Humphrey Visual Field (HVF) 24‑2 tests or virtual reality (VR)-based testing when patient positioning is a limitation—should be obtained within 1 to 2 months of the initial glaucoma evaluation.
In patients with suspected moderate to severe disease, baseline testing may need to be completed more rapidly to characterize damage and guide timely treatment. Ideally, the two baseline fields should be consistent, with a mean deviation (MD) difference of less than 1.5dB, regardless of defect severity.
Because many patients demonstrate a learning effect and perform better on subsequent tests, a third field should be obtained as soon as possible if the first two are inconsistent and used as baseline if it aligns more closely with the second.1 All in all, the baseline testing is ideally completed within the first 2 to 3 months of diagnosis.
Download the cheat sheet here!

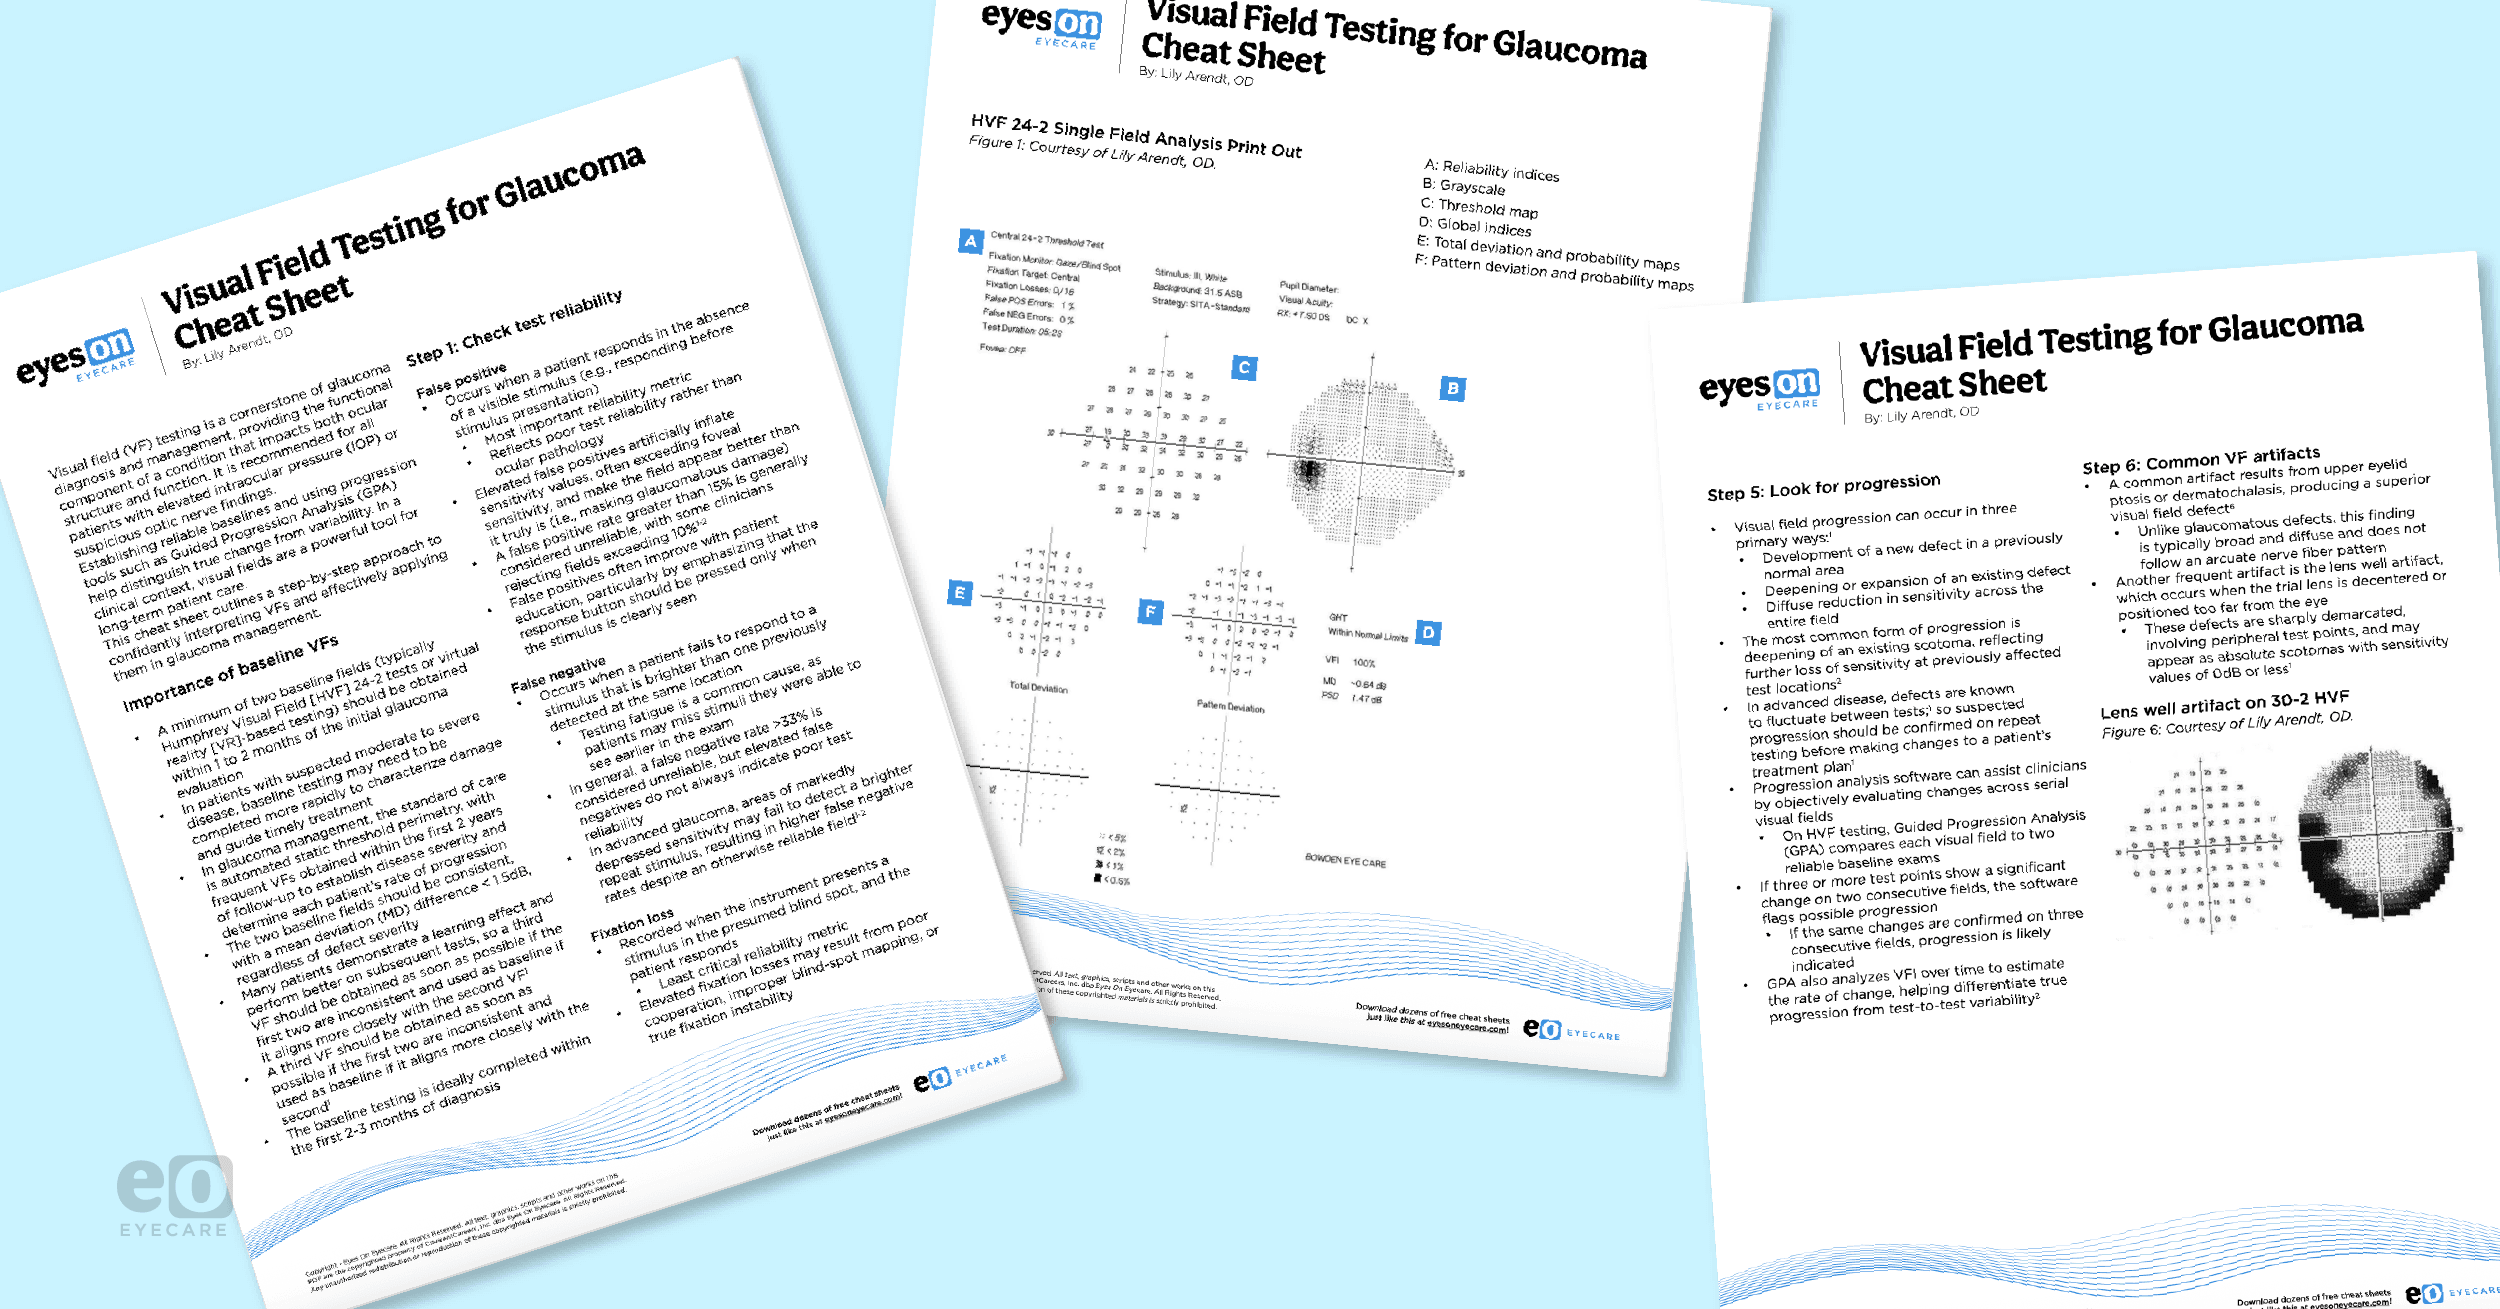
Visual Field Testing for Glaucoma Cheat Sheet
This cheat sheet features foundational information on visual field testing to monitor and diagnose glaucoma with tips, images of common glaucomatous defects, and common VF artifacts.

Step 1: Check test reliability
Visual field reliability is determined by three primary indices:
- False positives
- False negatives
- Fixation losses
Of these, the false positive rate is the most important.
False positive
A false positive occurs when a patient responds in the absence of a visible stimulus (e.g., responding before stimulus presentation) and reflects poor test reliability rather than ocular pathology.
Elevated false positives artificially inflate sensitivity values oftentimes exceeding foveal sensitivity and make the field appear better than it truly is. This can mask glaucomatous defects.
A false positive rate greater than 15% is generally considered unreliable, with some clinicians rejecting fields exceeding 10%.1-2 Fortunately, false positives often improve with patient education, particularly by emphasizing that the response button should be pressed only when the stimulus is clearly seen.
False negative
The next most important reliability index is the false negative rate, which reflects the patient’s attention and fatigue during testing. A false negative occurs when a patient fails to respond to a stimulus that is brighter than one previously detected at the same location.
Testing fatigue is a common cause, as patients may miss stimuli they were able to see earlier in the exam. In general, a false negative rate greater than 33% is considered unreliable. However, elevated false negatives do not always indicate poor test reliability.
In advanced glaucoma, areas of markedly depressed sensitivity may fail to detect a brighter repeat stimulus, resulting in higher false negative rates despite an otherwise reliable field.1-2
Fixation loss
The least critical reliability metric is fixation loss rate. Fixation losses are recorded when the instrument presents a stimulus in the presumed blind spot and the patient responds. Elevated fixation losses may result from poor cooperation, improper blind-spot mapping, or true fixation instability. Modern perimeters increasingly rely on videographic eye tracking, continuously monitoring pupil position throughout the test.
On the Single Field Analysis (SFA) printout, the gaze tracker displays upward deflections for eye movements and downward ticks for blinks or signal loss. A fixation loss rate greater than 20% is typically considered unreliable; however, because not all fixation losses represent true fixation errors, this metric is often discounted when false positive and false negative rates remain low.1
Step 2: Review global indices
Global indices provide a single-number summary of visual field performance and include:
- Mean deviation (MD)
- Pattern standard deviation (PSD)
- Visual field index (VFI)
Mean deviation
Mean deviation (MD) answers the question, “How does this patient’s overall retinal sensitivity compare with age‑matched normals?” It represents the average difference in retinal sensitivity (in dB) between the patient and the device’s normative database. Negative values indicate reduced sensitivity relative to normal, while positive values reflect better‑than‑average sensitivity.
MD is strongly influenced by diffuse factors such as cataract, uncorrected refractive error, and other media opacities, but is relatively insensitive to small, localized glaucomatous defects.
Pattern standard deviation
Pattern standard deviation (PSD) answers the question “How irregular is this visual field?” It quantifies localized variations in sensitivity across the field, making it particularly sensitive to focal defects. Early to moderate glaucomatous changes like nasal steps or arcuate scotomas typically increase PSD.
In contrast, in advanced or end‑stage disease where damage becomes diffuse, PSD may decrease as localized irregularity is lost. Unlike mean deviation, PSD is largely unaffected by media opacities.
Visual field index
Visual field index (VFI) answers the question, “What percentage of this patient’s visual field is normal for their age?” It ranges from 0% to 100%, with 100% representing a normal, age‑matched field and 0% indicating perimetric blindness.
As VFI is derived primarily from pattern deviation data, it is relatively insensitive to media opacities, cataract, and uncorrected refractive error. VFI also weights central test locations more heavily than peripheral points, often providing a better reflection of the patient’s functional vision.
Short on time? Check out the Visual Field Testing for Glaucoma Cheat Sheet!
Step 3: Assess the plots
Review the various plots to elucidate the severity of the disease:
- Grayscale plot: May draw attention to areas of potential abnormality, but it should not be used for clinical decision‑making
- Total deviation plot: Displays the difference in retinal sensitivity (in dB) between the patient and age-matched normal values at each test location
- Pattern deviation plot: Adjusts for generalized depression across the entire field highlighting focal areas of decreased sensitivity. As a result, the pattern deviation plot is the primary map used to identify focal glaucomatous defects
- Total and pattern deviation plots: Both have associated probability maps that indicate the statistical likelihood that observed defects occurred by chance, with darker symbols representing greater significance
Determining glaucomatous defect
To determine whether a defect is glaucomatous, the pattern deviation probability plot should be evaluated for clusters of abnormal points in characteristic locations,
When determining whether a defect is glaucomatous, clinicians should look for a cluster of three or more depressed points on the pattern deviation probability plot at the p<5% level, with at least one of those points depressed at the p<1% level while respecting the horizontal midline.1-2
The clusters should be in characteristic locations, including arcuate defects, nasal steps, paracentral scotomas, and temporal wedges. These focal defects reflect loss of retinal nerve fiber bundles and are often among the earliest visual field changes observed in glaucoma.
Arcuate defects
Arcuate defects result from damage to arcuate retinal nerve fiber bundles and typically originate at the blind spot, arching above or below fixation.3 Superior arcuate defects are particularly common in early glaucoma due to preferential damage of the inferior temporal retinal nerve fibers of the optic nerve.3
Nasal steps
Nasal steps consist of a cluster of three or more depressed points in the nasal visual field and often begin as an isolated scotoma.3-4 Superior and inferior nasal steps may coexist, which can give the appearance that the defect does not respect the horizontal midline.
However, because superior and inferior retinal nerve fiber loss rarely occurs symmetrically, one hemifield defect is typically more pronounced than the other.3
Temporal wedge defects
Temporal wedge defects appear temporal to the blind spot and typically occur later in the glaucomatous disease process, though they may be the initial defect in some patients.3 These defects result from damage to retinal nerve fiber bundles that converge nasal to the optic disc.
Paracentral scotomas
Paracentral scotomas are defects located within the central 16 test points of the 24‑2 visual field. They can occur early in glaucoma and are associated with damage to macular ganglion cells.
Because the 24‑2 and 30‑2 test patterns under sample the central field, paracentral defects are best evaluated with a 10‑2 visual field, which more accurately detects central glaucomatous damage.5
Step 4: Look for progression
Determining progression is a critical component of glaucoma diagnosis and management.
Visual field progression can occur in three primary ways:1
- Development of a new defect in a previously normal area
- Deepening or expansion of an existing defect
- Diffuse reduction in sensitivity across the entire field
The most common form of progression is deepening of an existing scotoma, reflecting further loss of sensitivity at previously affected test locations.2
Determining visual field progression can be challenging, particularly in advanced disease, where defects are known to fluctuate between tests.1 For this reason, suspected progression should be confirmed on repeat testing before making changes to a patient’s treatment plan.1
Utilizing GPA to monitor glaucoma progression
Progression analysis software can assist clinicians by objectively evaluating changes across serial visual fields. On HVF testing, Guided Progression Analysis (GPA) compares each visual field to two reliable baseline exams.
If three or more test points show significant change on two consecutive fields, the software flags possible progression; if the same changes are confirmed on three consecutive fields, likely progression is indicated.
GPA also analyzes VFI over time to estimate the rate of change, helping differentiate true progression from test‑to‑test variability.2
Identifying common VF artifacts
Visual field artifacts can significantly complicate interpretation. A common artifact results from upper eyelid ptosis or dermatochalasis, producing a superior visual field defect.6 Unlike glaucomatous defects, this finding is typically broad and diffuse and does not follow an arcuate nerve fiber pattern.
Another frequent artifact is the lens well artifact, which occurs when the trial lens is decentered or positioned too far from the eye. These defects are sharply demarcated, involving peripheral test points, and may appear as absolute scotomas with sensitivity values of 0 dB or less.1
Is it glaucoma or a neuro-ophthalmic problem?
Although visual fields are commonly obtained for glaucoma management, they may also reveal neuro‑ophthalmic pathology. Unlike glaucomatous defects, most neuro‑ophthalmic visual field defects respect the vertical midline rather than the horizontal.
For example, bitemporal hemianopia from a chiasmal lesion (e.g., pituitary tumor) and homonymous hemianopia from retrochiasmal pathology (e.g., stroke, trauma, or tumor) become evident when the right and left eye fields are assessed together.7
Altitudinal defects caused by anterior ischemic optic neuropathy or optic nerve compression may be mistaken for glaucomatous damage because they respect the horizontal midline. However, unlike glaucoma, altitudinal defects typically involve the entire superior or inferior hemifield, including paracentral and central test points.7
5 key takeaways
- Obtaining reliable baseline visual fields are essential for determining glaucomatous change over time.
- The false positive rate is the most important reliable index as a field with high false positives will artificially inflate sensitivity values and can mask shallow glaucomatous defects.1-2
- The Guided Progression Analysis on the Humphrey Visual Field is a useful tool to determine progression if you have two reliable baseline visual fields.2
- Knowing the expected glaucomatous visual field defects, such as arcuate defects, nasal steps, paracentral defects, and temporal wedges, will help distinguish true defects from test artifacts.3-5
- It is important to assess both the right and left eye visual fields for every patient to catch neuro-ophthalmic conditions.7
Final thoughts
Visual field testing is a cornerstone of glaucoma diagnosis and management, providing the functional component of a condition that impacts both ocular structure and function.
Accurate interpretation requires a systematic approach, starting with reliability, followed by analysis of global indices, probability plots, and defect patterns, while remaining alert for artifacts and non‑glaucomatous disease.
Establishing reliable baselines and using progression tools such as Guided Progression Analysis help distinguish true change from variability. In a clinical context, visual fields are a powerful tool for long‑term patient care.
