


With the introduction of two innovative pharmacological agents for the management of geographic atrophy (GA), the need for collaboration between optometrists and ophthalmologists is paramount.
Both professions bring unique expertise to the table: optometrists often serve as the primary point of contact in eyecare, while ophthalmologists play a crucial role in the medical management of GA.
Geographic atrophy: An overview
Geographic atrophy is an end-stage result of advanced age-related macular degeneration (AMD), leading to irreversible vision loss. It is defined as any sharply demarcated area(s) of hypopigmentation from the loss of the retinal pigment epithelium (RPE), photoreceptors, and the underlying choriocapillaris.
Geographic atrophy is typically a progressive, bilateral disorder that is associated with aging, genetics, and/or environmental factors. It is estimated to afflict some 5 million people worldwide, and its incidence increases with age.1
As people live longer, the threat of vision loss due to advanced AMD rises. When a patient has GA, visual acuity alone may not always be an accurate reflection of their vision impairment. These atrophic lesions typically appear outside of the fovea, but over time, they can expand and include the fovea.
Large areas of atrophy that are outside the fovea can cause paracentral scotomas and reduce a patient’s reading rate. Patients may also experience reduced contrast sensitivity and visual acuity in dim illumination.2
Progression of GA
The rate of GA progression can vary among individuals, but when the fovea is involved, it can then profoundly affect visual acuity.
Geographic atrophy progression rates demonstrate individual variability. Atrophic regions within the retinal pigment epithelium typically begin in the perifoveal region and expand to the fovea. The mean lesion growth rate range is from 0.53 to 2.6 mm²/year, with a median of approximately 1.78 mm²/year across studies.3
Researchers have been attempting to identify prognostic features of GA that can predict the growth rate. The size, location, and nature of the lesion can be used to evaluate its progression. Larger atrophic lesions, multifocal lesions, and extrafoveal lesions tend to progress more rapidly.3
The median time from the first diagnosis of GA to central GA was 2.5 years in a large prospective trial of individuals with AMD.4
Insights into imaging
Primary eyecare is often the setting where a patient is first introduced to their diagnosis of AMD. Optometrists play a vital role in identifying patients who have GA, and they must discuss the threat GA can have on vision. While a diagnosis of GA can be made with ophthalmoscopy, multiple imaging modalities can confirm the diagnosis and be used to track disease progression.
Color fundus photography (CFP), fundus autofluorescence (FAF), and spectral-domain or swept-source optical coherence tomography (OCT) are valuable diagnostic tools that have specific features for identifying geographic atrophy.
Color fundus photography (CFP)
CFP was used for the early classification of GA, characterized by an area of increased visibility of the choroidal vessels with a sharp, demarcated border of at least 175µm. It can be used to determine whether the lesions are unifocal or multifocal, as well as to assess their proximity to the fovea.
Color fundus photography is a beneficial imaging tool that can be used to counsel patients and monitor an increase in size and location of a lesion(s) over time. Initiating treatment is not urgent, and a patient might prefer to observe for change over time before deciding on therapy.
Figure 1: Color fundus photograph of an eye with extensive drusen and areas of RPE atrophy, which are characteristic findings of dry AMD.


Figure 1: Courtesy of Sara LeMay, OD.
Figure 2: FAF of the same eye as Figure 1. The dark, well-demarcated hypoautofluorescent area corresponds to the region of GA, indicating the absence of RPE cells and their associated lipofuscin


Figure 2: Courtesy of Sara LeMay, OD.
Fundus autofluorescence (FAF)
Fundus autofluorescence can also be used to image the size/location of geographic atrophy and document growth. Due to a lack of lipofuscin, FAF will show hypoautofluorescence with a ring of hyperautofluorescence.
FAF has been utilized in clinical trials and serves as a powerful patient education tool; the imaging modality is very “black and white” and, therefore, easy to convey the diagnosis and treatment goals to the patient.
Optical coherence tomography (OCT)
Optical coherence tomography is helpful in identifying biomarkers related to the onset and progression of GA. These biomarkers include hyperreflective foci, incomplete RPE, and outer retinal atrophy (iRORA), as well as the presence of subretinal drusenoid deposits.5 OCT is also used to rule out subretinal or intraretinal fluid that can indicate neovascular AMD.
Figure 3: OCT image of iRORA.


Figure 3: Courtesy of Sara LeMay, OD.
Figure 4: OCT image of hyperreflective foci.


Figure 4: Courtesy of Sara LeMay, OD.
Figure 5: OCT image of subretinal drusenoid deposit.


Figure 5: Courtesy of Sara LeMay, OD.
Using an OCT, GA will have marked choroidal hypertransmission due to RPE atrophy. A feature on the ZEISS OCT that can help with tracking RPE atrophy is the advanced RPE analysis. This has a few limitations, but it is being continually explored to track the progression of GA and allow clinicians to compare RPE changes over time.
Figure 6: Spectral-domain OCT (SD-OCT) scan showing features of GA. Note the thinning and loss of the outer retinal layers and the marked choroidal hypertransmission (brighter signal below the RPE) due to the atrophy of the overlying RPE layer.


Figure 6: Courtesy of Sara LeMay, OD.
GA patient selection, education, and referral
Patients who are ideal for treatment have GA with preserved central vision. This can be a patient with bilateral GA without foveal involvement, a patient with concomitant neovascular AMD and GA threatening the fovea, or a patient who has lost central vision in one eye due to subfoveal GA/nAMD and GA threatening the fovea in the other eye.
If a patient has early GA and minimal symptoms, it would not be urgent to initiate treatment. Still, it would be beneficial to take serial imaging to document change over time. This can be used as an educational tool to demonstrate the growth of GA to a patient and also determine the rate of growth and proximity to the fovea.
Once a patient is correctly educated on the limitations, benefits, and risks of treatment and remains motivated, they are the ideal candidate. If a patient is monocular due to nAMD or GA, discussing the initiation of treatment to delay vision loss in the better-seeing eye can be motivating for the patient.
Generally, this is an easier discussion as the patient has already experienced central vision loss in one eye and is likely motivated to protect their better-seeing eye for as long as possible. When GA therapy was first introduced, these patients were likely already established with a retina specialist, and some had even received an intravitreal injection in the past.
Most often, these patients present to their primary eyecare providers, i.e., optometrists, and require a referral to a retina specialist to discuss therapeutic options.
Best referral practices for GA patients
Primary eyecare providers can closely monitor patients with extrafoveal GA, preferably using the latest imaging technology, to determine if there is progression in lesion size or proximity to the fovea.
If a provider identifies growth in GA, especially if it is toward the fovea, then a referral to a retina specialist is recommended. Case in point, if a patient has juxtafoveal GA, then monitoring for progression could further delay treatment, and an earlier referral to a retinal specialist is recommended.
When a decision is made to refer a patient to a retinal specialist, there are several helpful practices that can ensure a smoother transition. Educating patients on these newly approved agents for GA and the purpose of the visit with a retina specialist is constructive.
Also, discussing the need for co-management as a retinal specialist cannot solely manage their comprehensive eyecare. Consider scheduling follow-up appointments to review the specialist’s recommendations and adjust the management plan as needed.
GA patient education
Taking the time to educate patients about their disease and their options can alleviate anxiety and encourage adherence to follow-up appointments. Especially in the case of GA, which can be insidious, patients must be informed about the impact this disease can have on their vision and its effect on their daily activities.
When GA is diagnosed by a primary eyecare provider, especially if it is extrafoveal and minimally impacts their daily activities, the provider should discuss the potential threat this poses as the disease progresses. Possible treatment options with complement inhibitors can be introduced, and then a referral to a retina specialist can be started.
When a patient reaches a retinal specialist clinic, they can be thoroughly counseled that these agents will not improve vision but will delay further vision loss. Adherence to scheduled injections without a well-defined therapeutic endpoint places a burden on patients and should also be discussed openly.
Although less frequent dosing reduces the risk of nAMD and other complications, it has less impact on reducing GA growth. However, most providers are leaning towards an every-other-month (EOM) schedule to minimize risk and injection burden.
Talking treatment: Considering complement systems
The complement system is an integral part of the immune system that sends proteins in response to microbes and stress. This system was suspected to play a role in the pathogenesis of GA through genome-wide studies that identified polymorphisms in several complement proteins in patients with AMD.
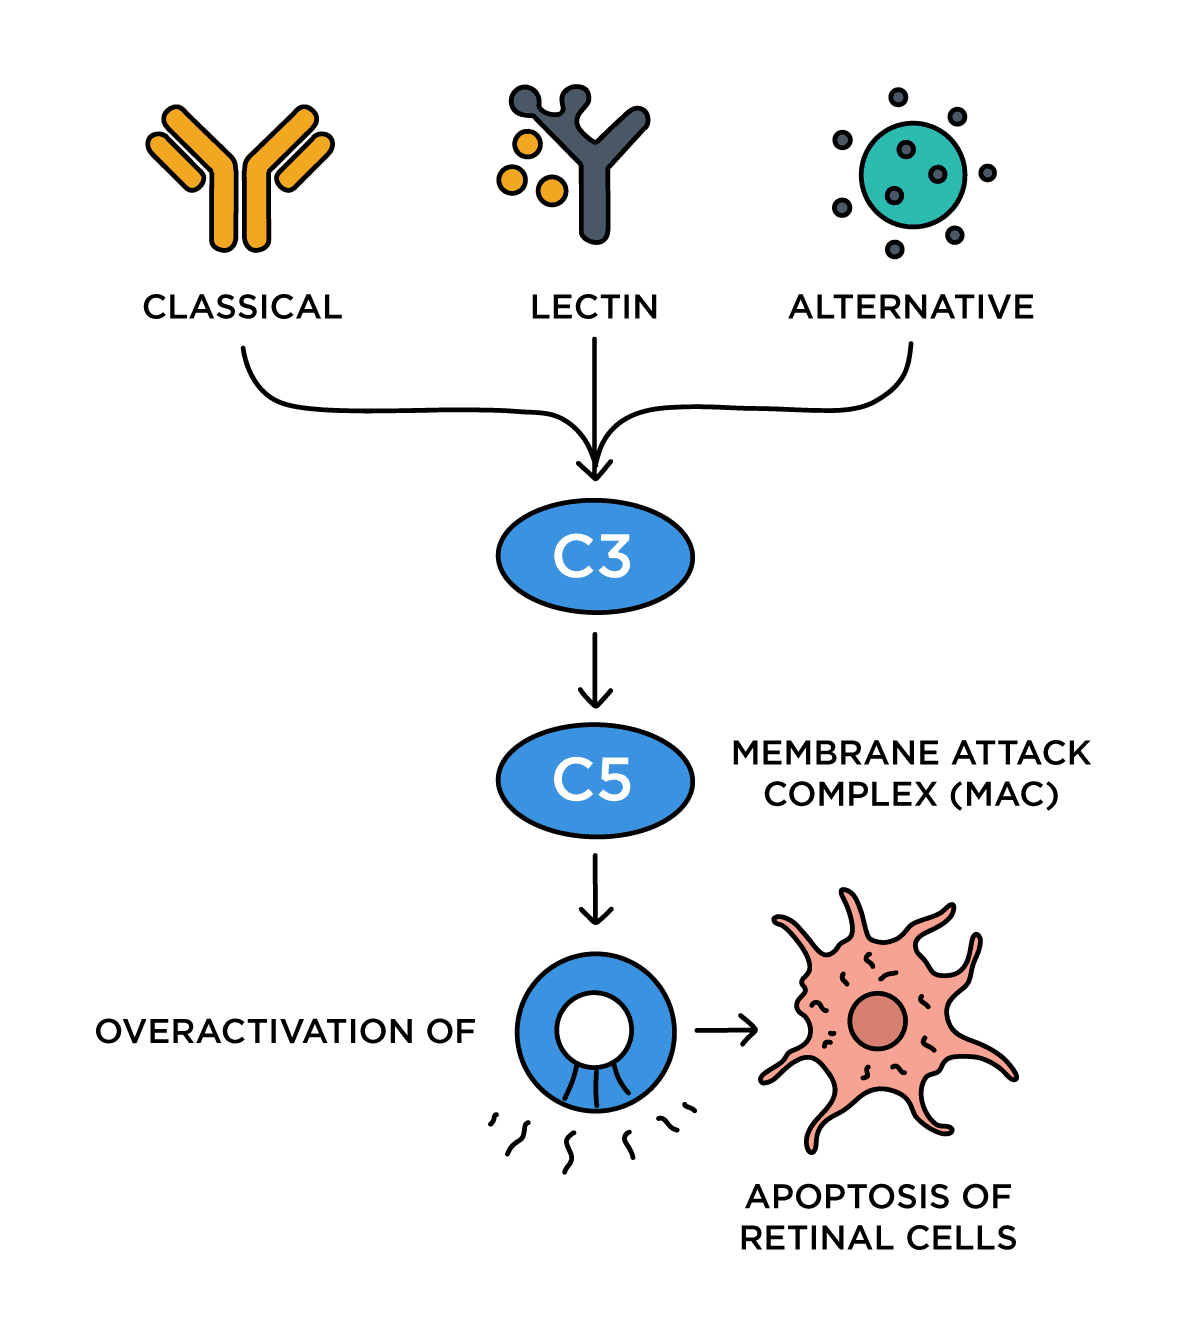
The complement system has three activation pathways, which converge at C3:
- Classical
- Lectin
- Alternative
Activation of the complement protein C3 and its further downstream activation of C5 will lead to the creation of the membrane attack complex (MAC). This overactivation of the complement cascade leads to the apoptosis of retinal cells due to the overexpression of the MAC protein, which causes cell membrane destruction.
Clinical studies have since found that patients with AMD have higher levels of C3 and C5 in the vitreous, and overactivation of the complement system is correlated with the progression of GA.
Figure 7: The complement pathway diagram below illustrates the complement cascade's role in GA. The classical, lectin, and alternative pathways all converge at C3, leading to the formation of the MAC, which causes apoptosis of retinal cells.

Pegcetacoplan and avacincaptad pegol
Until the most recent FDA approval of pegcetacoplan and avacincaptad pegol (ACP), there was an unmet medical need for patients with geographic atrophy. The FDA approved pegcetacoplan (SYFOVRE, Apellis Pharmaceuticals) on February 17th, 2023, with the finalization of the 24-month DERBY and OAKS studies.
Pegcetacoplan targets and binds C3 and C3b, which regulate the cleavage of C3, a complement enzyme in the alternative complement pathway. Both DERBY and OAKS determined that the rate of GA growth was reduced with pegcetacoplan compared to sham.
The studies included those with and without subfoveal involvement, and through these trials, it was determined that extrafoveal lesions exhibited less growth with treatment. The study also included monthly and EOM dosing.
The DERBY study found a 12% reduction compared to sham with EOM dosing and a 13% reduction with monthly dosing. The OAKS study found a 16% reduction compared to sham with EOM dosing and a 22% reduction in lesion growth with monthly dosing.
Alternatively, avacincaptad pegol (IZERVAY, Astellas Pharma) is a complement factor C5 inhibitor that the FDA approved after the GATHER1 and GATHER2 pivotal trials. The trials included patients with extrafoveal GA lesions that were within 1500μm of the center and used monthly dosing.
GATHER1 found a 35% reduction in GA growth in 12 months compared to sham, and GATHER2 showed a 17.7% reduction in GA growth, also over 12 months.
A closer look at the clinical trials for intravitreal complement inhibitors
Clinical studies have indicated a favorable safety profile for these medications; however, there are additional safety concerns with this drug class.
The potential problems include:
- Neovascular AMD (nAMD)
- Intraocular inflammation (IOI)
- Retinal vasculitis
- Retinal vascular occlusion
In the OAKS and DERBY study, patients treated with pegcetacoplan monthly had a rate of nAMD of 11.9%, compared to 6.7% EOM and 3.1% for the sham group. In the 24-month GATHER2 trial for ACP, the rate of choroidal neovascularization was 12% in patients treated with ACP, compared to 9% in sham patients.
IOI episodes have been defined to include:
- Vitritis
- Vitreous cells
- Iridocyclitis
- Uveitis
- Anterior chamber cells
- Iritis
- Anterior chamber flare
During the 24-month clinical trials, patients who were treated with pegcetacoplan monthly had a 4% rate of IOI versus 2% in patients treated EOM and <1% in the sham. In the GATHER1 and GATHER2 clinical trials, a single case of IOI was reported.
While the clinical trials for both agents did not report any cases of retinal vasculitis or vascular occlusive events, there were post-marketing reports of retinal vasculitis with intravitreal pegcetacoplan.
Physicians reported cases of retinal vasculitis to the American Society of Retina Specialists Research and Safety Committee (ASRS ReST) between April 2023 and October 2023. From these cases, 14 eyes of 13 patients were confirmed to have retinal vasculitis associated with a pegcetacoplan intravitreal injection.
Notably, all the cases of retinal vasculitis were after the first injection. At this time, there are no reports of retinal vasculitis after intravitreal ACP, except for an abnormal case of a Stargardt patient who received an injection of pegcetacoplan and then, 4 days later, ACP in the fellow eye, where vasculitis was confirmed in both eyes.
Many clinicians will consider treating the worst eye first to minimize the risk of IOI/vasculitis threatening the better-seeing eye.
Geographic atrophy case report
A 74-year-old female presents to your clinic for a comprehensive eye examination. She complains of mild blurry vision in both eyes that has been slowly getting worse for several years.
The patient’s general health background includes hypertension, diabetes, and high cholesterol. These conditions are well controlled with the use of oral medication. The patient reports a history of cataract extraction in both eyes 10 years prior and a family history of glaucoma.
Clinical findings:
- Best-corrected visual acuity (BCVA):
- OD: 20/20
- OS: 20/20
- Intraocular pressure (IOP, tonopen)
- OD: 16mmHg
- OS: 17mmHg
Figure 8: Baseline ultra-widefield color fundus image of the case patient's right eye (OD), revealing multiple confluent patches of extrafoveal geographic atrophy and surrounding drusen.


Figure 8: Courtesy of Sara LeMay, OD.
Figure 9: Baseline ultra-widefield color fundus image of the case patient's left eye (OS), showing drusen and a smaller, single area of extrafoveal geographic atrophy.


Figure 9: Courtesy of Sara LeMay, OD
Figure 10: Baseline FAF of the patient's right eye (OD). The hypoautofluorescent areas clearly demarcate the multifocal GA lesions located temporal to the fovea.


Figure 10: Courtesy of Sara LeMay, OD.
Figure 11: Baseline FAF of the patient's left eye (OS). The single hypoautofluorescent area clearly demarcates the unifocal GA lesions located temporal to the fovea.


Figure 11: Courtesy of Sara LeMay, OD.
As seen in Figures 8 and 9, the patient has extrafoveal geographic atrophy that is worse in the right eye. This GA can be more easily appreciated in the FAF photos also taken during this visit, in Figures 10 and 11. After a discussion about her condition and treatment options, the patient preferred to be monitored, and a follow-up was rescheduled for 6 months.
6-month follow-up
When the patient presented for her 6-month follow-up, she reported no changes in her vision since her last visit.
Clinical findings:
- BCVA
- OD: 20/20
- OS: 20/20
- IOP (tonopen)
- OD: 16mmHg
- OS: 15mmHg
At this visit, the same imaging was ordered, which was ultra-widefield imaging and FAF. The fundamental comparison can be best appreciated by using a side-by-side view of the FAF.
As seen in Figure 11, a subtle change was observed when compared to 6 months prior. The multilobulated geographic atrophy lesions that are temporal to the fovea have enlarged, coalesced, and grown towards the fovea.
Figure 12: Side-by-side FAF comparison of the right eye at baseline (left) and 6 months later (right). The images show clear progression of GA, with enlargement and coalescence of the lesions, which are now closer to the foveal center.


Figure 12: Courtesy of Sara LeMay, OD.
Figure 13: Side-by-side FAF comparison of the left eye at baseline (left) and 6 months later (right). This eye shows only slight enlargement of the GA lesion, demonstrating much less progression than the right eye over the same period.


Figure 13: Courtesy of Sara LeMay, OD.
Complement inhibitor therapy was discussed and initiated on the right eye with the intention of reducing the progression of GA, especially towards the fovea.
Co-management is critical
Patients must understand that when they are referred to a retinal specialist for a chronic disease like AMD, their comprehensive eye examinations should not be suspended. In a subspecialty retina clinic, patients often present for their intravitreal injections with questions about their refractive needs, dry eye disease, and other related concerns.
Primary eyecare providers are responsible for explaining the purpose of the referral. We recommend scheduling a follow-up to ensure a smooth transition and emphasize the importance of continued primary eyecare.
Conclusion
The novel treatment with complement inhibitors offers an option for patients to slow the growth of vision-threatening GA. The role of the complement system in the pathogenesis of GA has garnered considerable attention, leading to the exploration of potential future therapies for GA.
As these therapies transform the treatment landscape and improve outcomes for patients, it is our responsibility to educate our patients. As clinicians, it is our responsibility to diagnose GA early and discuss options.
