


An accurate classification of age-related macular degeneration (AMD) is essential for guiding patient management and predicting the risk of progression to advanced stages.
Over the years, several staging systems have been developed to grade AMD. Most notable are the AREDS, Beckman, and the updated AREDS simplified grading scale.1-3
Overview of AMD classification frameworks
The three frameworks mentioned above are observational and can be used with a fundus examination alone. The Beckman classification provides a framework that defines early, intermediate, and late AMD based on drusen size and pigmentary changes.2
In contrast, the AREDS Simplified Severity Scale offers a numerical risk model that quantifies progression probability using a point system derived from fundus findings.1 Most recently, the updated AREDS Simplified Severity Scale builds upon this foundation by incorporating reticular pseudodrusen (RPD) as an additional biomarker, enhancing the model’s predictive accuracy in the era of advanced imaging.3
AREDS
The AREDS study was a prospective randomized clinical trial conducted from 1992 to 2006.1 The scoring system assigns 1 point per eye for each risk factor: Large drusen and pigmentary changes. For the study, 1 point would be assigned for the presence of 1 or more large drusen (which is defined as ≥125μm, i.e., width of a large vein at disc margin).1
In addition, 1 point would also be assigned for the presence of any pigment abnormality. Risk factors are summed across both eyes on a scale from 0 to 4, and an approximate 5-year risk of developing advanced AMD in at least one eye can be determined.1
Figure 1: Risk factor scoring for a patient with large drusen and pigment abnormalities in both eyes.1


Figure 1: Courtesy of Frederick L Ferris, 3rd, et al.
The AREDS study’s estimates of 5-year risks for the development of advanced AMD for each of the steps from 0 to 4 are 0.4%, 3.1%, 11.8%, 25.9%, and 47.3%, respectively.1
Figure 2: Approximate 5-year rates of progression to advanced AMD according to the number of risk factors.1

Figure 2: Courtesy of Frederick L Ferris, 3rd, et al.
Download the cheat sheet here!

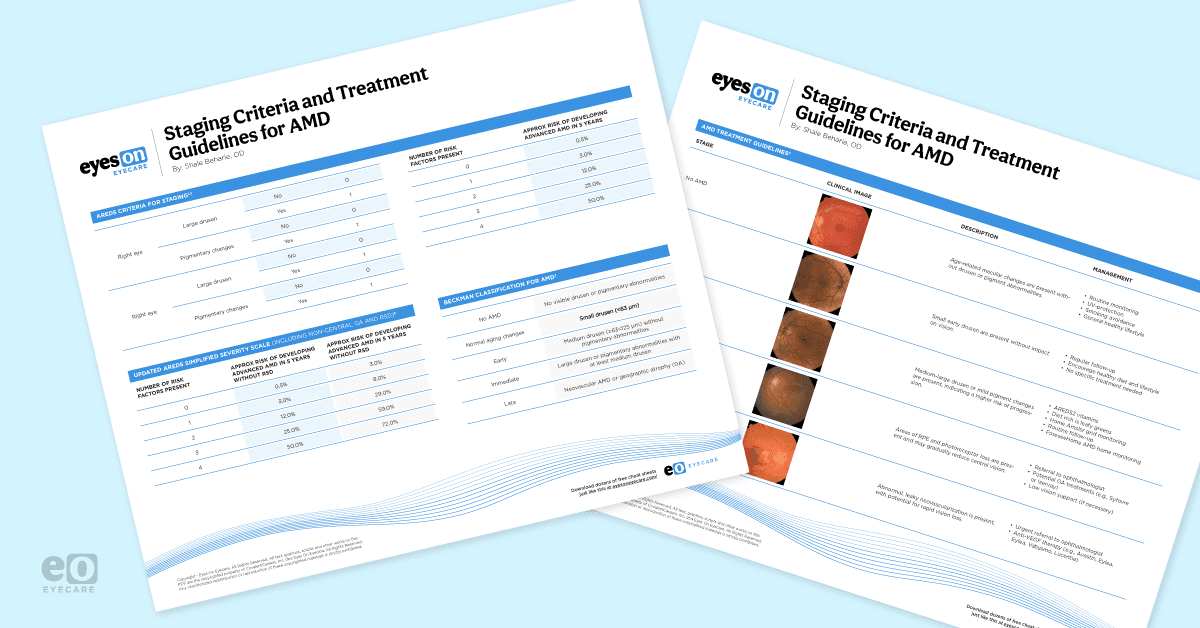
Staging Criteria and Treatment Guidelines for AMD
Use this cheat sheet to facilitate staging and risk stratification of AMD patients, with clinical images and outlines of all three AMD staging systems.

Beckman classification
The Beckman criteria provide a simpler classification, staging AMD based on fundus lesions within 2 disc diameters of the fovea in people older than 55 years.2 No visible drusen or pigmentary abnormalities are considered to have no signs of AMD.
Drusen size is categorized as follows:2
- Small drusen (<63μm) are considered normal aging changes with no clinically relevant increase to developing.
- Medium drusen (≥63 to <125μm) without pigmentary abnormalities is considered early AMD.
- Large drusen or pigmentary abnormalities with at least medium drusen are considered intermediate AMD.
- Neovascular AMD or geographic atrophy (GA) is considered late AMD.
5 year risks of progressing to late AMD range from a 0.5% for normal aging changes to a 50% risk for the highest intermediate AMD risk group.2
Updated AREDS simplified severity scale
AREDS Report No. 42 refined the original Age-Related Eye Disease Study model by incorporating RPD as a new, independent risk factor for progression to late AMD.3
This revision acknowledges advances in imaging and the current understanding of AMD pathophysiology, particularly the role of subretinal drusenoid deposits in disease progression. The new scale maintains the 0 to 4 point system based on drusen size and pigmentary abnormalities, but now stratifies each risk level by the presence or absence of RPD.3
Eyes with RPD show substantially higher 5-year progression risks. For example, the range for progression to advanced AMD for patients without RPD is 0.3% for 0 risk factors, up to 50% for 4 risk factors.3 In patients with RSD, that number jumps up to 3% for 0 risk factors, up to 72% with 4 risk factors.
The updated model also broadens the definition of late AMD to include non-central geographic atrophy, making it more clinically relevant. Overall, this revision preserves the simplicity of the original AREDS system while improving its predictive accuracy.
Table 1: Approximate 5-year risk for progression to advanced AMD:3
| Number of Risk Factors | 5-Year Risk of Progression to AMD: Patients Without RPD | 5-Year Risk of Progression to AMD: Patients With RPD |
|---|---|---|
| 0 | 0.3% | 3% |
| 1 | 4% | 8% |
| 2 | 12% | 29% |
| 3 | 27% | 59% |
| 4 | 50% | 72% |
Table 1: Courtesy of Elvira Agrón et al.
Drusen characteristics and progression
Drusen are sub-RPE deposits composed of lipids/proteins and are the hallmark lesion of AMD.4 Beyond drusen size, total drusen volume is an important predictor of progression.3 Eyes with a volume ≥0.03mm3 are four times more likely to develop late AMD than eyes with lower volumes.5
Location also influences risk, and while extramacular drusen are not directly associated with progression from intermediate to late AMD, they may contribute to enlargement of macular drusen, increasing total drusen volume and thereby elevating progression risk.5-16
Figure 3: Fundus photography of intermediate AMD; significant drusen in the macula and subtle juxtafoveal RPE changes can be visualized.


Figure 3: Courtesy of Michael Ammar, MD.
Drusen regression adds further complexity to disease trajectory. In a recent retrospective study of 427 eyes with intermediate or atrophic AMD and soft drusen, 24.2% demonstrated drusen regression without atrophy, showing that drusen disappearance is relatively common.17 However, 94% of these cases exhibited a nearby area of drusen collapse with subsequent atrophy, indicating that regression frequently reflects underlying RPE instability.17
Figure 4: En-face optical coherence tomography (OCT) imaging revealing drusen regression and GA progression.


Figure 4: Courtesy of Daniel Epshtein, OD, FAAO.
This pattern supports the drusen-ooze hypothesis, which will be discussed later, in which drusen material exits through RPE defects rather than resorbing. As a result, drusen regression may not be a favorable sign. It may in fact, signal increased risk for progression to atrophy.17
Reticular pseudodrusen, described earlier, differ from conventional drusen by their location above the RPE.6 Their presence also carries prognostic significance. A post hoc analysis from AREDS2 demonstrated that eyes with RPD had a significantly higher risk of progressing to late AMD, particularly geographic atrophy, highlighting their role as an additional structural biomarker of advanced disease risk.6
Figures 5 and 6: Fundus and OCT imaging, respectively, showing reticular pseudodrusen (shown as a nodular hyperreflective subretinal deposit on OCT). There are also vertical hyperreflective columns on OCT suggestive of RPE disruption.


Figure 5: Courtesy of Carolyn Majcher, OD, FAAO, FORS.


Figure 6: Courtesy of Carolyn Majcher, OD, FAAO, FORS.
Short on time? Check out the cheat sheet Staging Criteria and Treatment Guidelines for AMD!
Retinal pigmentary changes (hyper/hypopigmentation)
Pigmentary abnormalities, seen as areas of hyperpigmentation or hypopigmentation on fundus photographs, are another key marker of AMD severity and an important predictor of progression to late disease.18 These findings reflect disturbances in the RPE, including migration or dysfunction, and are a core component of the AREDS classification system.6
In the AREDS study, pigmentary changes were shown to precede the development of geographic atrophy in most cases. Hyperpigmentation occurred before GA in 96% of eyes, and hypopigmentation preceded GA in 82%.19
The average interval to GA onset was approximately 5 years for hyperpigmentation and 2.5 years for hypopigmentation, highlighting their prognostic value.19 Alongside drusen characteristics, pigmentary abnormalities are vital in clinical staging and risk assessment.
Figure 7: Color fundus photography demonstrating an extrafoveal hypopigmented area of GA with well-demarcated borders.


Figure 7: Courtesy of Carolyn Majcher, OD, FAAO.
Figure 8: Ultra-widefield imaging (UWF) in the right eye of a patient with neovascular age-related macular degeneration (nAMD) and pigmentary changes.


Figure 8: Courtesy of Joseph J. Pizzimenti, OD, FAAO, FORS.
Understanding macular neovascularization
According to the Consensus Nomenclature for Reporting Neovascular Age-Related Macular Degeneration Data, the recommended term for new vessel growth in the macula is macular neovascularization (MNV), which seeks to replace terms like choroidal neovascularization (CNV/CNVM).7
This change in nomenclature leads to more specificity, as neovascularization in AMD may originate not only from the choroid but also from the outer retina and sub-RPE layers.7 Neovascularization is also not exclusive to the macula, and can develop in the parapapillary area or extra macularly.
The classification divides MNV into:7
- Type 1: Ingrowth of vessels from the choriocapillaris into the sub-RPE space (commonly forming PEDs, which arise directly from this sub-RPE localization)
- Type 2: Vessels grow above the RPE into the subretinal space
- Type 3: Also known as retinal angiomatous proliferation (RAP), where neovascularization arises within the retina itself and may then anastomose with deeper vasculature
Figure 9: Images showing type 2 MNV; A: Fundus photograph from a 74-year-old showing a hyperpigmented ring in the fovea (arrow). Early-phase fluorescein angiogram showing (B) a well-defined lesion with late leakage and (C) obscuration of the borders of the neovascular lesion. D: B-scan OCT showing the outer retinal lesion with extension of subretinal fluid under the fovea. The ingrowth site through the retinal pigment epithelium is evident (arrow).


Figure 9: Type 2 MNV©Courtesy of Richard Saide et al. Image used under CC BY-NC-ND 4.0.
AMD findings on diagnostic imaging
Modern diagnostic imaging is central to diagnosis. OCT is critical for identifying the structural components of lesions (PEDs, sub-RPE vs subretinal components). Meanwhile, OCT angiography (OCT-A) allows non-invasive visualization of neovascular networks down to the capillary level.14 This can be particularly helpful in cases of nonexudative MNV.
As opposed to exudate MVN, nonexudative MNV will have abnormal choroidal vessels pass through breaks in Bruch’s membrane, but have no signs of hemorrhage or exudation.15 This distinction is important, as treatment differs from the exudative variant.15
Hyperreflective foci (HRF)
Once believed to be migrating RPE cells, hyperreflective foci are now suggested to be macrophages engulfing RPE cells.6 They appear on OCT as small (<30μm) hyperreflective, round, dot-like lesions, and can be found in any retinal layer and the choroid.6 Due to their small size, they are not visible via fundus photos. OCT is necessary to determine their presence.
While similar in appearance to retinal exudates, HRF can be differentiated as they are not bound to the outer plexiform layer.13 Clinically, HRF has been proven to be an independent risk factor for the conversion to neovascular AMD within 24 months for patients with intermediate AMD. Moreover, HRF within drusenoid lesions independently predicted the development of geographic atrophy.11
Figure 10: Fundus autofluorescence (FAF) and OCT imaging of a patient with intermediate AMD; the FAF shows granular and hyperautofluorescent defects near the retina, likely caused by drusen and photoreceptor damage, but no signs of geographic atrophy. The OCT scan shows a drusenoid PED and a hyperreflective foci directly above it.


Figure 10: Courtesy of Mary Beth Yackey, OD.
Drusen ooze
Drusen ooze refers to the movement of drusenoid material from the RPE into the outer retina, reflecting underlying RPE dysfunction or collapse.8 It is recognized as a structural biomarker of intermediate to advanced nonexudative AMD and has been reported in 41 to 65% of dry AMD cases.9,10
In fact, a recent study showed that eyes with intermediate AMD demonstrating drusen ooze had a 20.3-fold increased likelihood of progressing to RPE/outer retinal atrophy, though this feature was not associated with a higher risk of conversion to exudative AMD.10
On OCT, drusen ooze appears as a hyperreflective signal that may coincide with RPE thinning.10 Differentiating drusen ooze from choroidal neovascularization is essential, as anti-VEGF therapy is not indicated for drusen ooze alone.
Figure 11: Spectral-domain OCT scan (A) of a druse that has already started the atrophy process. A defect in the RPE above the druse is seen, as well as hyperreflective dots at the outer nuclear layer and abundant material visible as isoreflective tiny dots. B: An enlarged image of the same druse. C: In the color picture, the hyperreflective material at the top of the same druse corresponds to pigment clumping (arrow).


Figure 11: Drusen ooze©Courtesy of Jordi Monés et al. Image used under CC BY-NC-ND 4.0.
5 key takeaways
- The Beckman and AREDS classification systems have distinct approaches to staging. Beckman is based on drusen size and pigmentary changes (normal aging, early, intermediate, late AMD), while AREDS uses a point-based scale that predicts 5-year progression risk based on large drusen and pigment abnormalities in each eye.1-3
- Reticular pseudodrusen are a biomarker of progression risk. RPD are different from conventional drusen by being located above the RPE. Their incorporation into the updated AREDS severity scale reflects their strong prognostic value in contemporary imaging-based assessment.3
- Drusen ooze is also a predictor of atrophy. It is found when drusen material “oozes” into the outer retina through areas of RPE compromise. It is present in about half of intermediate AMD eyes and increases the likelihood of progression to RPE/outer retinal atrophy more than 20-fold.9,10
- This is an important distinction from neovascularization, as drusen ooze does not warrant anti-VEGF therapy.
- Drusen regression should not be interpreted as disease improvement. Although drusen has a life cycle and may spontaneously regress or collapse, regression is frequently associated with underlying RPE damage.8
- Drusen size and volume are foundational predictors of progression. Large drusen and high total drusen volume (≥0.03mm³) are strong, independent indicators of progression risk.5 While extramacular drusen do not directly cause advanced AMD, they contribute to overall drusen burden.
