


This case represents the complexity and overlap between diabetic retinopathy and hypertensive retinopathy.
Case report
A 59-year-old Caucasian female was referred to our clinic as a glaucoma suspect with mild non-proliferative diabetic retinopathy.
These are the findings from the day of our exam:
- VA and approx refractive error: +0.25-0.50x80 OD and +0.75-0.50x110 OS
- Both are correctable to 20/20
- Corneal compensated IOP (CcIOP): 22mmHg OD and 24.7mmHg OS, with a reported TMax of 24mmHg and 26.3mmHg
- Pachymetries: In the thick range at 612 and 613
- Medical history:
- Type 2 diabetes: 11 years
- Hypertension: 5 years
- Hypercholesterolemia: 6 years
- Family history:
- Cataracts
- Glaucoma
- Diabetes
- Hypertension
- Medications:
- Losartan
- Metformin
- Insulin
- Simvastatin
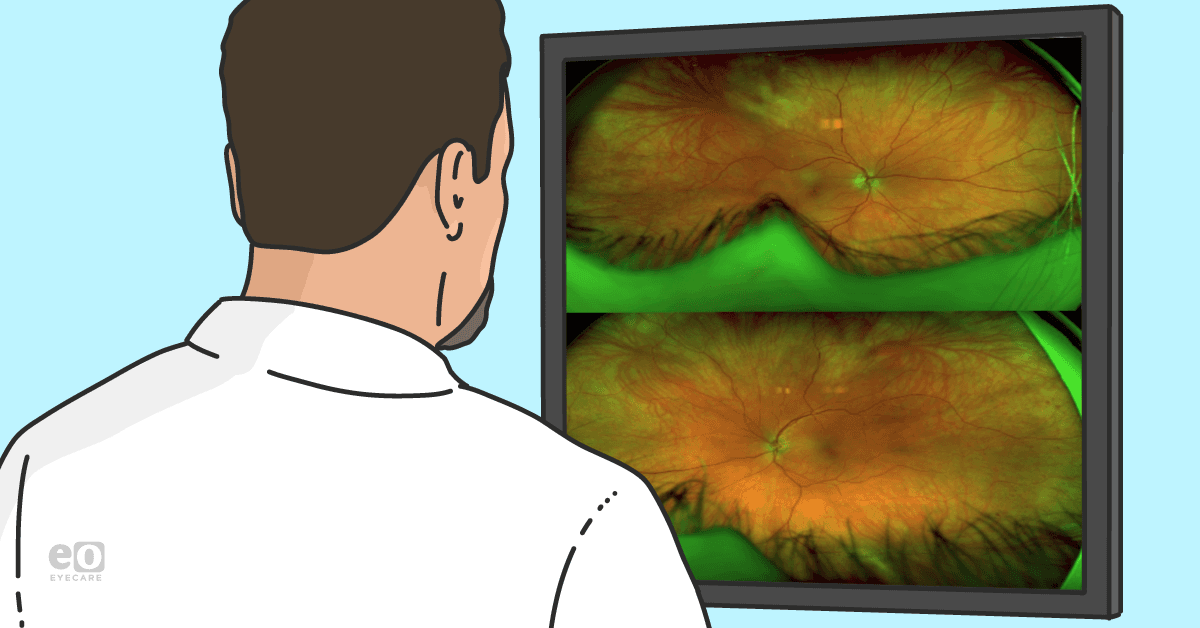
Figures 1a and 1b: Widefield imaging revealing mid-peripheral and peripheral dot and blot hemorrhages that were a little worse in the left eye than the right. She also has some A/V nicking and some venous beading as well.


Figure 1a: Courtesy of Michael Cymbor, OD, FAAO.


Figure 1b: Courtesy of Michael Cymbor, OD, FAAO.
Figures 2a and 2b: Fundus photographs of the optic nerves that exhibit no obvious asymmetry in cupping.


Figure 2a: Courtesy of Michael Cymbor, OD, FAAO.


Figure 2b: Courtesy of Michael Cymbor, OD, FAAO.
Figure 3: However, when we look at the visual field results from a 24-2 test, we see some asymmetry. The patient has a mean defect of 3.3 OD and a mean defect of 1.7 OS.


Figure 3: Courtesy of Michael Cymbor, OD, FAAO.
A few things stand out on the OCT / OCT angiography (OCT-A) report in Figure 4 as well. For example, when you look at the ganglion cell complex report, there's quite a bit of asymmetry between the right eye and the left eye, and there's also quite a bit of asymmetry between the superior and inferior macular regions.
The supertemporal area on the nerve fiber layer caught my attention because it shows thinning OD on RNFL thickness and TSNIT. When you combine this finding with the ganglion cell complex thinning, it raises a lot of suspicion for glaucomatous damage.
Figure 4: OCT and OCT-A imaging OU demonstrating signs of glaucomatous damage.


Figure 4: Courtesy of Michael Cymbor, OD, FAAO.
Visual field polar analysis
Visual field polar analysis is a graphic representation of the visual field damage as it relates to the optic nerve. The worse the visual field damage, the longer the red line. If the NFL defect is supratemporal, we would expect to see longer red lines in that region.
Figures 5a and 5b: Upon closer examination of OCT metrics (5a), the visual field polar analysis (5b) reveals no expected supratemporal reduction.


Figure 5a: Courtesy of Michael Cymbor, OD, FAAO.


Figure 5b: Courtesy of Michael Cymbor, OD, FAAO.
This indicates structure-function discordance. The OCT-A quadrant view also reveals asymmetry of the foveal avascular zone, which is greater OD than OS, and it indicates that there may be some reduction in blood flow, as seen in Figure 6.
Figure 6: OCT-A quadrant view OU, highlighting asymmetry of the foveal avascular zone OD > OS and signs of reduced blood flow.


Figure 6: Courtesy of Michael Cymbor, OD, FAAO.
A careful angle inspection is also important in all cases of glaucoma and glaucoma suspects. I was able to see a scleral spur on gonioscopy.
Figure 7: Anterior segment OCT images showing that the angles are open but somewhat narrow.


Figure 7: Courtesy of Michael Cymbor, OD, FAAO.
Dealing with discordance
I suspected glaucoma OD, but the structure-function discordance between OCT and visual field made this case a bit more challenging. While there was some visual field asymmetry affecting the right eye more than the left eye, there really wasn't enough data to convince me that this patient had glaucoma.
As such, I ordered an electroretinogram (ERG) to explore whether a functional deficit existed and whether it could be localized to the photoreceptor layer or ganglion cell layer. We want the amplitude to be strong (i.e., as close to 100% as possible).
However, in this patient, the A wave amplitude is reduced to 10% and 17%. This is most likely due to photoreceptor disruption, resulting from a combination of reduced perfusion from diabetic retinopathy and hypertensive retinopathy. The B wave was relatively unaffected.
Photopic negative response (PhNR) is a measure of ganglion cell and optic nerve function, and we want the implicit time to be fast (i.e., as close to 0 as possible). In this case, we have 100% in the right eye versus 47% in the left. In terms of amplitude, we have a really weak result of 5% in the right eye versus 33% in the left. This asymmetry in the implicit time and amplitude OD indicates ganglion cell and optic nerve dysfunction.
Figure 8: PhNR report OU showing asymmetry in implicit time and amplitude between the right and left eye.


Figure 8: Courtesy of Michael Cymbor, OD, FAAO.
Adjusting the diagnosis based on imaging results
Based on these findings, I made a new diagnosis of hypertensive retinopathy. In addition, I also changed her diagnosis from mild nonproliferative to moderate nonproliferative diabetic retinopathy. This decision was made based on the presence of microaneurysms and venous beading.
In terms of glaucoma, we needed to correlate structure and function, but the OCT polar analysis failed to demonstrate that. The ERG, on the other hand, offered objective functional data that helped clinch the diagnosis of primary open-angle glaucoma in the right eye. As a result, the patient was sent for bilateral selective laser trabeculoplasty (SLT).
Conclusion
In sum, I probably would have monitored this patient for 6 months to a year before seeing OCT structural progression and OCT-field concordance. The ERG helped me make the diagnosis earlier.
