


I’ve always believed that more information doesn’t necessarily translate into better care—unless that information is objective, actionable, and tied to meaningful outcomes. Electroretinography (ERG) is a tool that has filled this gap for my practice and brings new light to my diabetic retinopathy (DR) management.
Unlike optical coherence tomography (OCT) or fundus photography, ERG measures something entirely different: the retina’s ability to function. And in diabetic eye disease, that matters more than many realize.
The role of ERG in diabetic retinopathy
ERG doesn’t replace structural imaging—it complements it. In fact, it often clarifies what structural tests alone can’t explain. I’ve seen patients with unremarkable OCT findings and only mild fundus changes who, based on that data alone, might appear stable.
But when their DR Score—a composite measure of implicit time, amplitude, and pupil response—is elevated, I know they’re at significantly higher risk of needing intervention. Research shows these patients are 11 times more likely to require treatment within 3 years.1 That’s not a detail I can afford to overlook.
In my clinic, ERG has transformed how I manage diabetic eye disease. It helps me personalize follow-up intervals, identify high-risk patients early, and guide conversations that resonate. I discovered this first-hand when two DR patients presented to my office on the same day with similar clinical presentations but vastly different ERG findings.
2 similar patients, 2 very different findings
Patient #1: Glaucoma suspect
Patient 1 was a 63-year-old male who was presenting for follow-up of bothersome dry eye symptoms and mild DR with macular edema. The patient had been diagnosed with diabetes at age 37. His HbA1c was 6.0. His best-corrected visual acuity (BCVA) was stable at 20/20 OD and 20/25 OS.
Figure 1: The dilated retinal exam revealed a few scattered dot hemes in both eyes, which are difficult to appreciate on the Optomap. The decreased BCVA was related to cataracts and dry eye.


Figure 1: Courtesy of Kelly MacDonald, OD.
Figures 2 and 3: The OCT revealed a very mild area of macular edema in the right eye (Figure 2) and an unremarkable left eye appearance (Figure 3).


Figure 2: Courtesy of Kelly MacDonald, OD.


Figure 3: Courtesy of Kelly MacDonald, OD.
Patient #2: Diabetic retinopathy follow-up
Later that same morning, another patient with mild DR presented for follow-up. This 55-year-old male was also diagnosed at age 37 and had a slightly higher HbA1c of 9.1. However, this second patient had no history of macular edema. Like Patient 1, Patient 2 had not noticed any visual changes and had a BCVA of 20/20 OD and 20/25 OS.
Figure 4: The dilated retinal exam for Patient 2 showed scattered dot and blot hemorrhages OU, and there was an area of myelinated nerve fiber layer (NFL) superior OD that had hemes within the myelination.


Figure 4: Courtesy of Kelly MacDonald, OD.
In fact, there were several dot hemes in the macula of each eye, but otherwise his retinopathy had been quite stable since his previous exam.
Figures 5 and 6: The OCT was unremarkable OD (Figure 5), but I noted mild cystic changes OS (Figure 6), which indicated very early, mild macular edema.


Figure 5: Courtesy of Kelly MacDonald, OD.


Figure 6: Courtesy of Kelly MacDonald, OD.
Why was the ERG test performed?
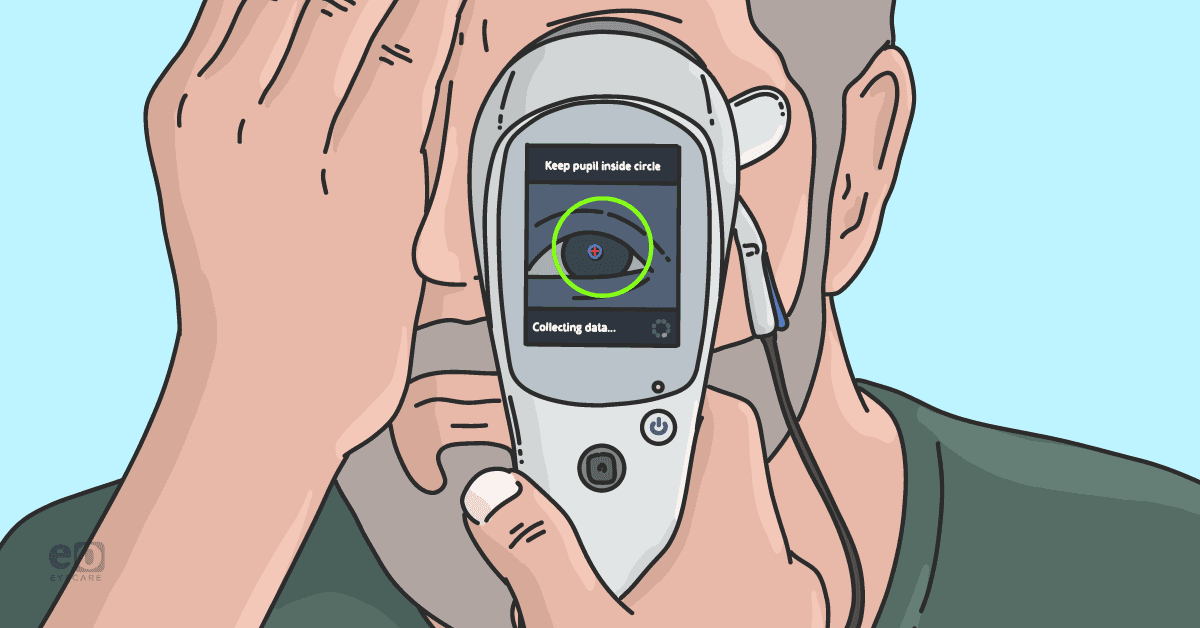
I recently acquired a RETeval device, which measures the electrical activity of the retina in response to light, thereby indirectly assessing the function of the rods and cones. Structural imaging plays a key role in detecting visible retinal abnormalities, but it doesn’t capture how well the retina is functioning.
That’s where ERG becomes essential—it evaluates retinal performance and can reveal problems before anatomical changes appear.2 In fact, studies suggest that ERG may offer superior predictive value in terms of forecasting DR progression.3,4
When these two diabetic patients presented for examination, I had only just recently started to grasp and appreciate the clinical applications of ERG and the implications that these diagnostic findings could have in my day-to-day practice. While thinking about whether to add an ERG device, I had the intention of using it to best assess and screen my diabetic patients.
Therefore, it was quite a coincidence that they presented close together on the same day. Overall, I wanted a more complete picture of my patients with diabetes so I could more confidently follow them over time and determine appropriate visit intervals.
A rundown of ERG findings
My RETeval produces three important readings for DR evaluations:
- The implicit time indicates the degree of cellular stress. Implicit time delays require further investigation.
- Amplitude indicates the degree of cellular damage. Reduced amplitudes require further investigation.
- DR Score is derived from a normative age-matched database. It is a numeric reading that evaluates the amplitude and timing of the retinal response to the stimuli, as well as the pupillary response.
- If the DR Score is 23.5 or higher, there is an 11-fold increase in the likelihood that retinal intervention (laser or anti-VEGF) will be needed within 3 years.1
Figure 7: Patient 1 had a DR Score of 17, which helped explain how macular edema could persist for 3 years yet not need treatment. Note: The DR score is a bilateral score, so there is no unilateral data.


Figure 7: Courtesy of Kelly MacDonald, OD.
Management of patients with chronic retinopathy is often challenging, and having an objective means of assessing the retina has proven extremely helpful in guiding my decision-making.
Figure 8: Despite similar OCT findings relative to Patient 1, Patient 2 had a DR Score of 27, which was disconcerting since he had been stable for several years with no notable progression of disease that I could detect or document prior to this initial ERG.


Figure 8: Courtesy of Kelly MacDonald, OD.
How did the ERG impact next steps?
While patients with macular edema are typically followed more frequently, as this patient's macular edema was longstanding and had been stable for many years, I felt the normal DR score was likely to be predictive of his ongoing stability.
Therefore, I felt comfortable with extending his follow-up to 6 months. Conversely, I was now more worried about Patient 2 and shortened his follow-up interval to 3 months.
Figure 9: At that 3-month follow-up visit for Patient 2, I learned that he lowered his HbA1c for the first time in almost 20 years, and his DR score also decreased from 27.0 to 26.5.


Figure 9: Courtesy of Kelly MacDonald, OD.
The patient asked me if he could go back to 6-month visits if he continues to maintain better control. Although I am not yet comfortable stretching out the visits, I am encouraged that the DR Score provided much-needed motivation for the patient.
When I show a patient a color-coded DR Score and explain what it means, I see the lightbulb go off. Suddenly, my advice to follow up sooner or improve glycemic control doesn’t feel like a generic warning—it’s tied to data from their own eyes.
In conclusion
As of November 2023, the Centers for Disease Control and Prevention (CDC) revised its National Diabetes Statistics Report, estimating that 136 million adults in the US have either diabetes or prediabetes—an increase of 6 million from the previous year.5,6 The rising number of individuals with diabetes underscores the increasing strain DR places on patients and the healthcare system alike.
As optometrists, we’re the gatekeepers of vision. Our role is to detect early dysfunction, stratify risk, and refer at the right time. If we wait until anatomical changes become obvious, we’ve already lost precious ground. Diabetic retinopathy is often silent until it isn’t. With ERG, I can detect functional decline before vision is lost—and patients can act while there’s still time.
I’ve come to rely on ERG in gray-zone cases—the ones that feel ambiguous, where imaging doesn’t match symptoms or systemic status. It fills in the gaps. It validates clinical suspicion. And, it helps my patients understand the “why” behind my recommendations. Ultimately, ERG brings clarity—clarity that drives better care.
My goal is to use the RETeval to enhance patient care by providing clarity in complicated cases. To that end, I use ERG for patients with diabetic retinopathy, macular degeneration, optic nerve issues (ex., edema, atypical cupping, atrophy, etc.) and cases where the diagnosis is in question and information about retinal function will be clinically useful. The ERG testing is performed by our technicians as part of a testing schedule that also includes OCT and visual fields.
While the research on ERG is what initially motivated me to bring it into practice, seeing how it has a real impact on patient management daily has made me so grateful to have this tool at my disposal. Using ERG on back-to-back patients, who I would otherwise have managed identically, truly impacted patient care immediately.
