


Papilledema or pseudopapilledema, that is the question. Evaluation of the elevated optic nerve head poses a particularly difficult clinical dilemma due to numerous clinical commonalities and the need to exclude potentially life-threatening conditions. Though every patient with an elevated optic nerve head requires a comprehensive clinical approach to arrive at a proper diagnosis, OCT imaging provides complementary diagnostic information to aid in the management of these difficult cases.
The elevated optic nerve head can be caused by numerous conditions such as optic neuritis, ischemic optic neuropathy, neuroretinitis, papilledema, and pseudopapilledema. Our discussion will focus on the latter two etiologies, since acute forms of an elevated optic nerve head tend to be relatively straightforward diagnoses. Whereas papilledema is a predominately bilateral optic disc edema secondary to increased intracranial pressure of any cause, pseudopapilledema is defined as any condition that funduscopically mimics papilledema.
OCT in papilledema, beyond RNFL thickness
When it comes to OCT measurements of optic neuropathies, all clinicians are comfortable ordering and interpreting a retinal nerve fiber layer (RNFL) thickness scan. These are the scans we use to detect RNFL thinning in glaucoma or nonglaucomatous disease. But when it comes to evaluation of the elevated optic nerve head, the RNFL is often thicker than expected.
Unfortunately, RNFL thickness measurements alone can not be used to distinguish normal, pseudopapilledema, and papilledema patients due to the significant overlap of RNFL thickness measurements. In fact, some patients with true papilledema may have a statistically normal RNFL thickness.
Due to the significant optic nerve head anatomical changes, the OCT segmentation algorithm may fail and provide erroneous thickness measurements. For this reason, some researchers have begun using peripapillary total retinal thickness and peripapillary total retinal volume measurements to help detect papilledema. These scan protocols image the optic nerve head with a 6x6mm macular cube scan (the standard macular scan protocol) and measure all structures between the internal limiting membrane and Bruch’s membrane.
In addition, these scan protocols have been found to reduce the frequency of artifactual measurements and improve discrimination between papilledema and pseudopapilledema. Unfortunately, these scan protocols do not have commercially available normative databases, therefore their clinical utility is limited for the average clinician.
In Figure 1, below, various thickness maps are represented.

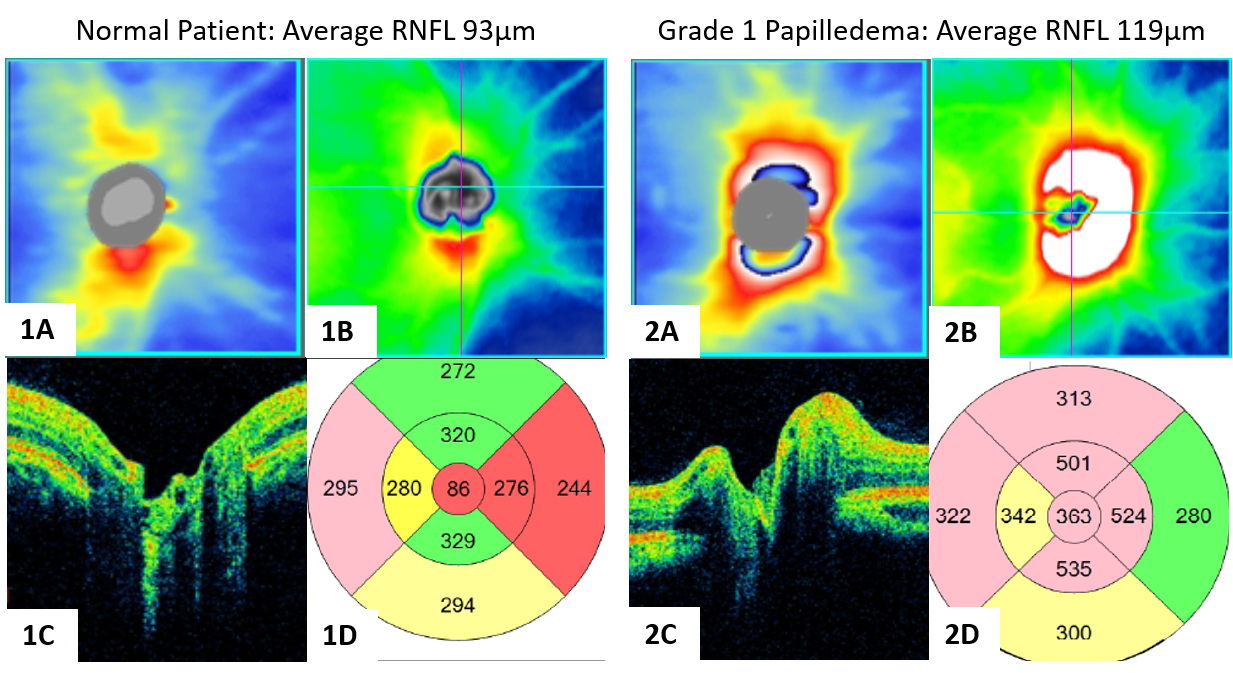
Figure1: 1A RNFL thickness map, 1B peripapillary total retinal thickness map, 1C optic nerve head OCT, 1D peripapillary total retinal thickness of a normal patient. 2A RNFL thickness map, 2B peripapillary total retinal thickness map, 2C optic nerve head OCT, 2D peripapillary total retinal thickness of a patient with grade 1 papilledema.
OCT detection of optic disc drusen
Though quantitative optic nerve OCT measurements are less than ideal for the evaluation of the elevated optic nerve head, qualitative assessment has much greater utility. The detection of optic disc drusen is the most valuable ability that the OCT offers in the evaluation of the elevated optic nerve head.
Optic disc drusen are extracellular deposits within the optic nerve head that become calcified with age. Superficial optic disc drusen are often easily visualized with ophthalmoscopy but buried disc drusen must be detected with ancillary testing. Using a high-definition raster OCT scan, preferably in enhanced depth imaging mode, optic disc drusen can be visualized as hyporeflective ovoid lesions anterior to the lamina cribrosa. The optic disc drusen will often have a hyperreflective margin, especially towards the anterior edge of the lesion.
It is important to distinguish optic disc drusen from blood vessels, as both may be visualized as ovoid hyporeflective lesions. Blood vessels typically do not have a hyperreflective margin and tend to create a larger shadowing effect than optic disc drusen. Scanning through sequential scans can help differentiate optic disc drusen and vasculature, as blood vessels are long tubular structures and optic disc drusen are discrete structures.
Figure 2 shows an OCT scan of an optic nerve head drusen, not the mild hyperreflective superior margin.

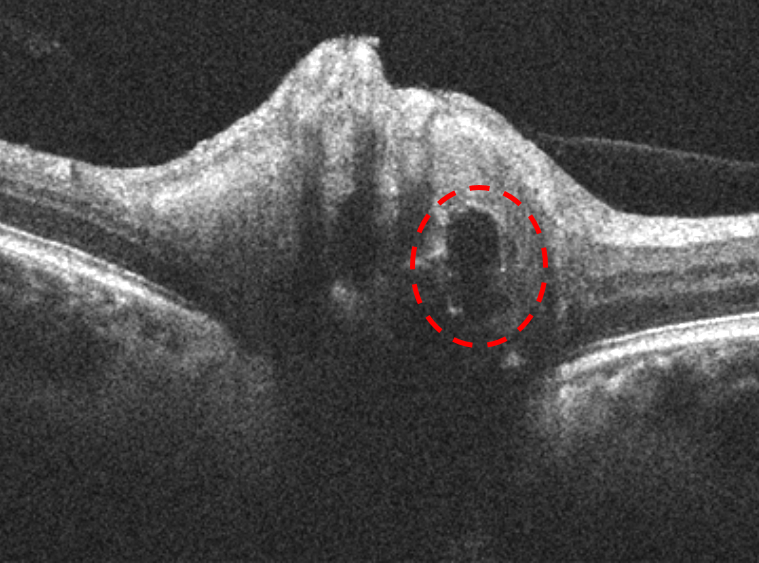
Figure 2
Peripapillary hyperreflective ovoid mass-like structures (PHOMS) can be found at the border of the optic nerve head and retina and are thought to represent herniated or distended optic nerve axons. PHOMS can be found in both papilledema and pseudopapilledema. It is unclear if these structures confer any pathological risk but is important to ensure that PHOMS are not diagnosed as optic disc drusen.
Figure 3 demonstrates an OCT scan with PHOMS, an ovoid hyperreflective structure thought to represent herniated or distended optic nerve axons.

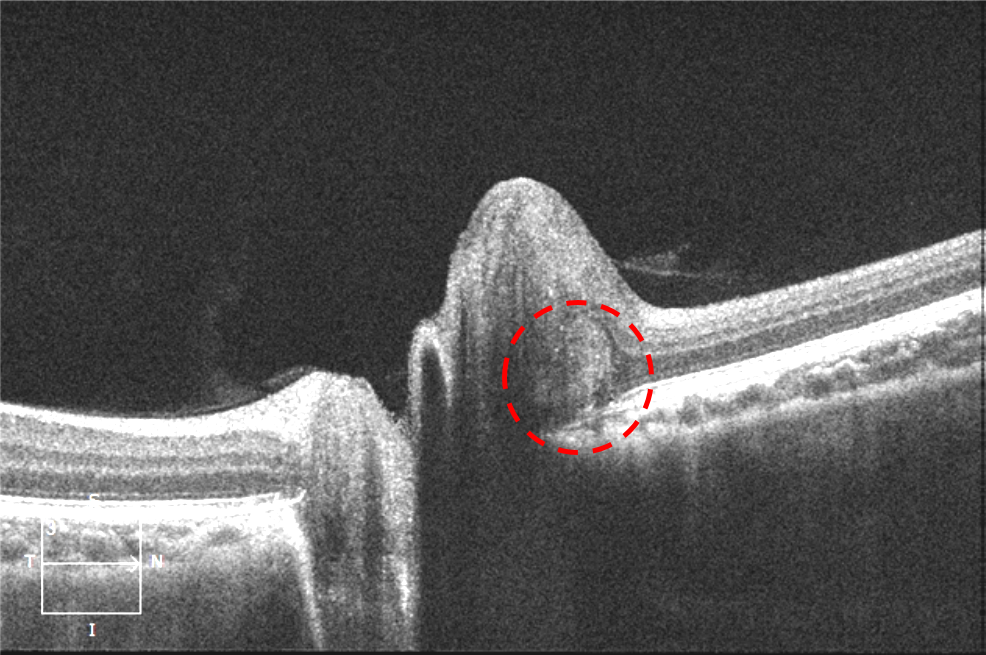
Figure 3
Optic nerve head and axon shape changes
Aside from detecting optic disc drusen, qualitative OCT assessment of the elevated optic nerve head can reveal direct signs of papilledema. As intracranial pressure increases, the posterior globe flattens. This deformation can be visualized with both MRI and OCT. In normal patients and those with pseudopapilledema the angle of the peripapillary Bruch’s membrane is neutral or bowed posteriorly.
In cases of papilledema, the angle of the peripapillary Bruch’s membrane can bow forward. Unfortunately, not all cases of papilledema will present with anterior deformation of Bruch’s membrane—but when present, anterior deformation of Bruch’s membrane is a good indicator of papilledema. As patients with papilledema are treated, the angle of the peripapillary Bruch’s membrane will normalize and can be used as a biomarker of disease.
In Figure 4, image 1 depicts the optic nerve head shape and Bruch’s membrane contour in a normal patient. Image 2A depicts the anterior deformation of Bruch’s membrane in a patient with papilledema.
After 4 weeks of Diamox treatment, the patient’s papilledema has begun to resolve and Bruch’s membrane angle has normalized.

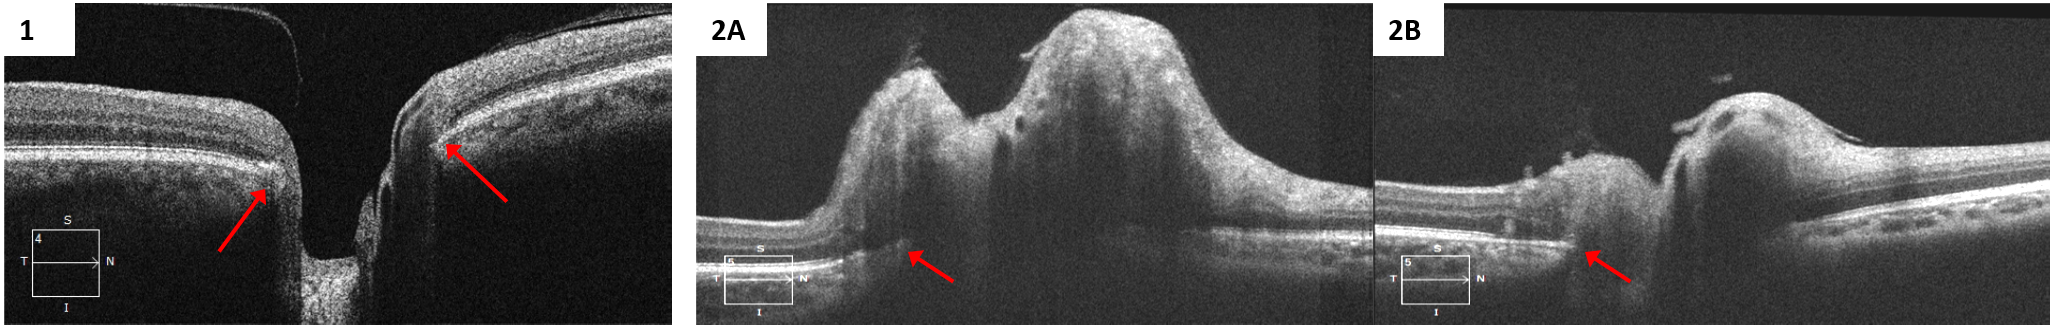
Figure 4
As the optic nerve head becomes more edematous, the RNFL will become more distended. This axon distention can lead to peripapillary wrinkles which are the OCT correlates of clinical Paton’s folds. Peripapillary wrinkles are visualized as small undulations in the anterior border of the or concentric linear structures on enface OCT.
In Figure 5, red arrows point to peripapillary wrinkles on cross-sectional OCT and enface OCT.

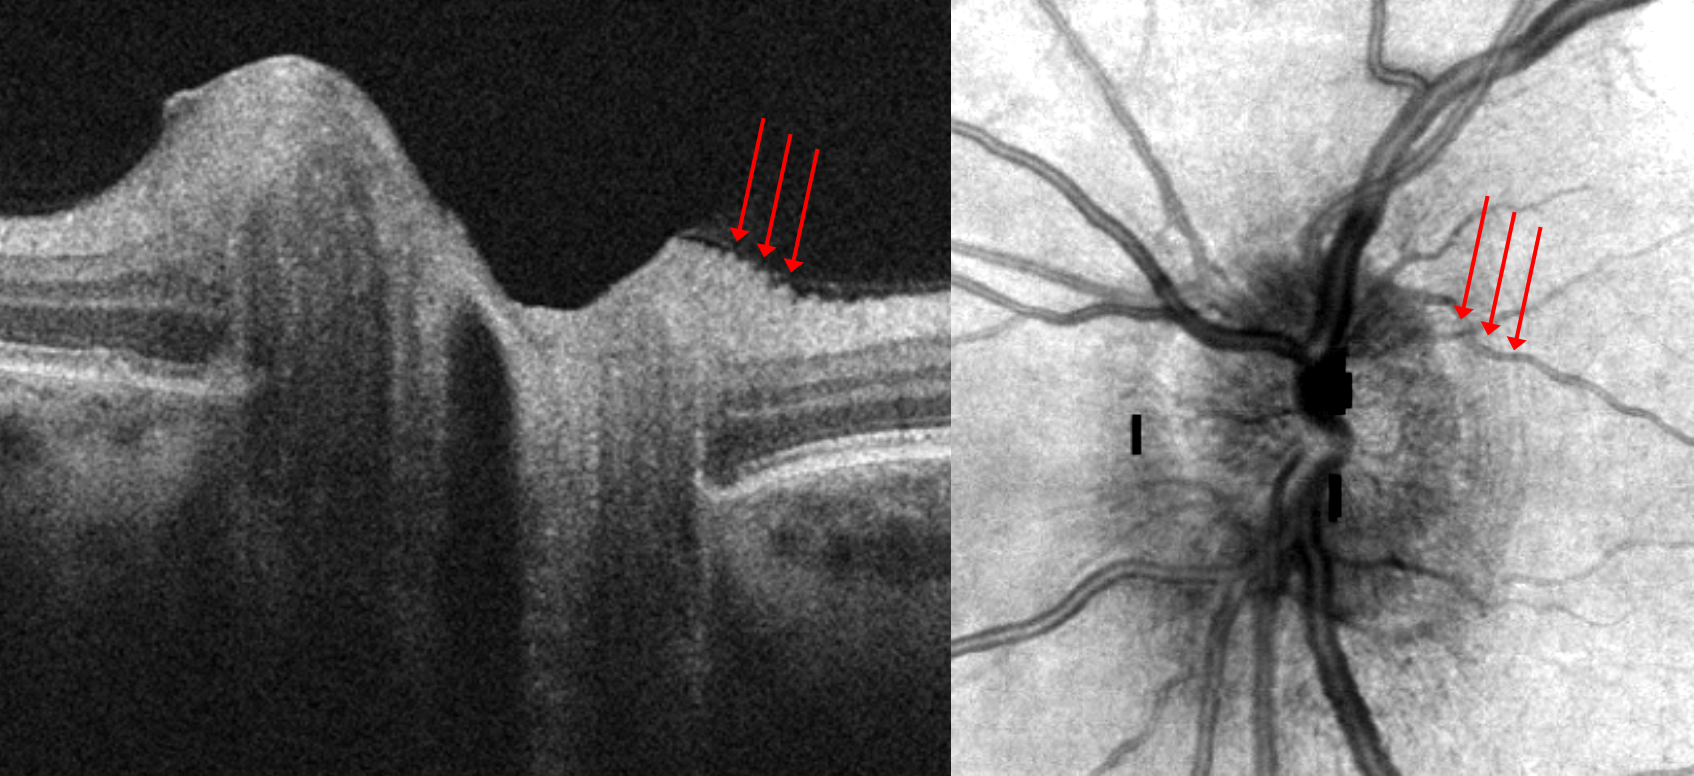
Figure 5
In moderate to severe cases of disc edema, the optic disc can begin to leak serous fluid. Though often difficult to distinguish clinically, OCT findings of peripapillary subretinal or intraretinal are easily detectable. In cases of papilledema with decreased vision, it is important to rule out subretinal or intraretinal fluid affecting the macula. The change of vision from macular fluid is not equivalent to papilledema-induced optic neuropathy visual deficits and can greatly alter a treatment plan.
Figure 6 represents peripapillary subretinal fluid, indicated by the red markers. Peripapillary wrinkles are also noted with the green arrows.

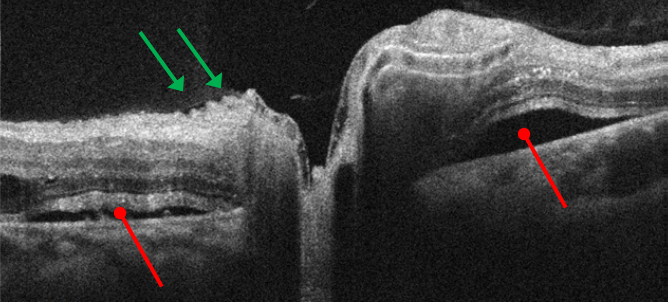
Figure 6
Conclusion
Even with advances in technology, the evaluation of papilledema and pseudopapilledema remains equivocal. Though OCT cannot provide a simple report on whether a patient has papilledema and how urgently that patient requires neurological workup, OCT can detect anatomical changes which improve the clinician’s ability to distinguish papilledema from pseudopapilledema.
We have a direct partnership with ZEISS!

