


WHAT YOU'LL LEARN
What a glaucoma suspect is and how to determine the risk level for developing glaucoma
Evaluating glaucomatous progression
An integrative understanding of fundus imaging, visual field and OCT finding
Clinical case applications
What is a Glaucoma Suspect?
What is a Glaucoma Suspect?
According to the American Academy of Ophthalmology, a glaucoma suspect is an individual with clinical findings and/or a constellation of risk factors that indicate an increased likelihood of developing glaucoma.
Risk factors for Glaucoma include:
- Increased cupping, cup asymmetry, RNFL defects, disc hemorrhage
- Elevated IOP
- Thin pachymetry
- Age
- Visual field defects consistent with glaucoma
- OCT (RNFL and macular) defects consistent with glaucoma
- Family history
- African or Hispanic descent
- Pseudoexfoliation/pigment dispersion
- Myopia
Patients who can be categorized as definitively having “no glaucoma” will present generally healthy, with no significant optic nerve cupping, normal intraocular pressure (IOP), and no retinal nerve fiber layer (RNFL) defects. On the other hand, there are patients with “definite glaucoma,” those who present with severe amounts of optic nerve cupping, very high IOP, and/or several RNFL defects. Both groups are fairly easy to distinguish. However, there is a group that falls in between these two, comprising of patients who are glaucoma suspects, ocular hypertensives, and those with anomalous optic discs. These types of patients can make it tricky in deciding the best course of treatment.
Of the risk factors discussed above, these are the more pertinent ones to pay attention to when assessing the level of risk involved in developing glaucoma: family history, higher IOP, thinner central cornea, disc hemorrhage, larger cup-to-disc ratio, pigment dispersion syndrome, and pseudoexfoliation. Two or fewer risk factors are considered to be low-risk, while three or more are considered to be high-risk.
The Ephstein-Laul Paradigm may also be considered when determining glaucoma risk as it describes the criteria for varying risk levels and differential diagnoses for ONH pathology
- Low risk: some risk factors, but OCT/VF unremarkable
- Medium risk: some risk factors with borderline OCT/VF
- High risk/Inconclusive glaucoma: risk factors with discordant VF/OCT findings
- Patients with confounding testing results such as high myopia or other comorbidities
- Definitive glaucoma: documented progression or corresponding OCT/VF defects
- Non-glaucomatous optic neuropathy
It is important to note that a large percentage of glaucoma suspect referrals are made on the basis of either large cup to disc ratios, elevated IOP over 21 and/or narrow angles. Other pertinent reasons that warrant a referral, such as pseudoexfoliation and pigment dispersion, are often missed, particularly seen in cases where patients have smaller optic discs or normal IOP.
What to do with a Glaucoma Suspect
At the initial glaucoma work-up visit, it is imperative to perform gonioscopy. Note that it is not possible to diagnose primary open angle glaucoma without a gonioscopic exam. In addition, a baseline OCT, visual field exam, pachymetry, and fundus photos should also be done. Follow-up testing should comprise a repetition of these tests, based on the perceived risk.
The following flowchart can assist in determining when to see a glaucoma follow up:

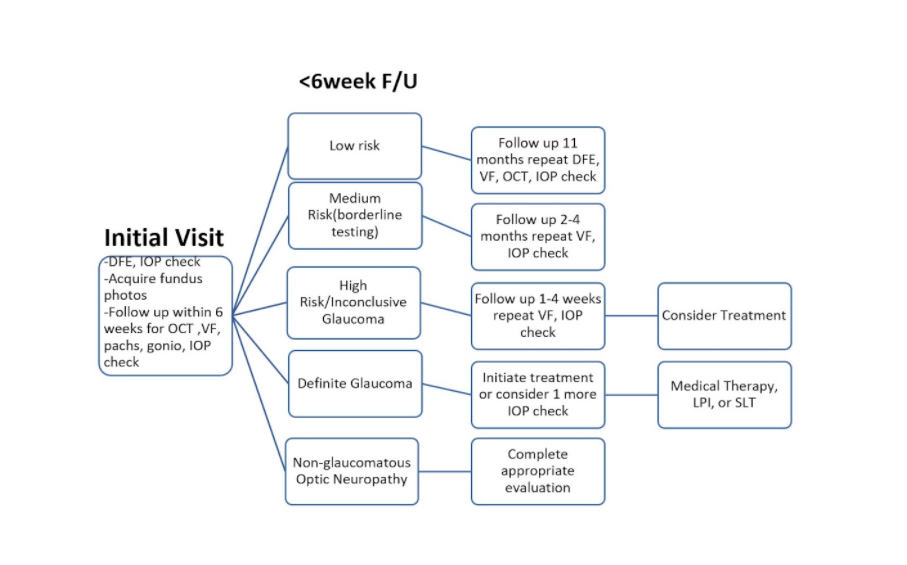
Clinical tip: Many times, you may have a patient who presents initially with one or two risk factors and the clinician is likely assuming that this patient is at a relatively low risk for developing glaucoma. Additional baseline testing a few weeks later may end up revealing a higher risk for glaucoma than initially expected. For instance, a patient may initially present with slightly suspicious optic nerves, but their IOP falls within the high teens and there is no known family history of glaucoma. You may be led to think this is a low-risk patient. However, when they present for follow-up within the six weeks, the OCT scan shows a wedge defect. This is now an indication of a higher risk of glaucoma. Hence, this stresses the importance and relevance of baseline testing in assessing the true risk and thus, solidifying the correct diagnosis.
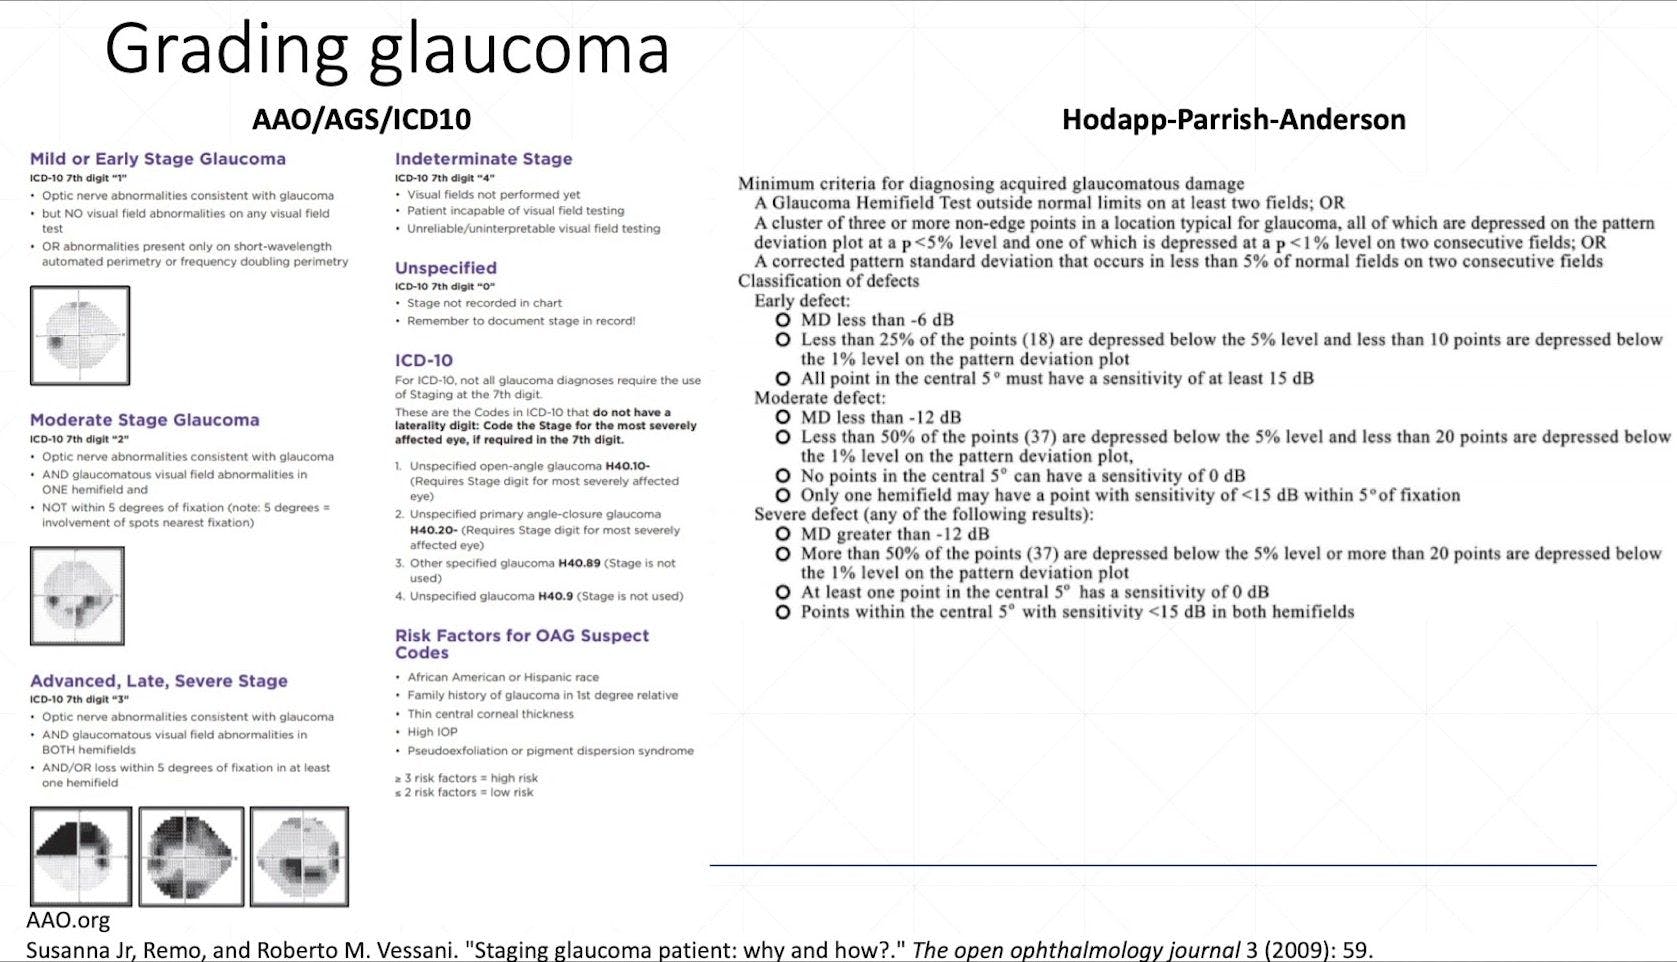
Grading Glaucoma
There are several methods used to grade glaucoma. Majority of the time, when grading glaucoma in a clinical setting, the American Academy of Ophthalmology scale is used. For research and academia purposes, the Hodapp-Parrish-Anderson scale is most often used.

When to Follow Up with Glaucoma Patients
Although every patient’s treatment plan will differ since it is truly customized on a case-by-case basis, there is a general timeframe that can be utilized based on the type and stage of glaucoma and the suggested type of testing for each visit.

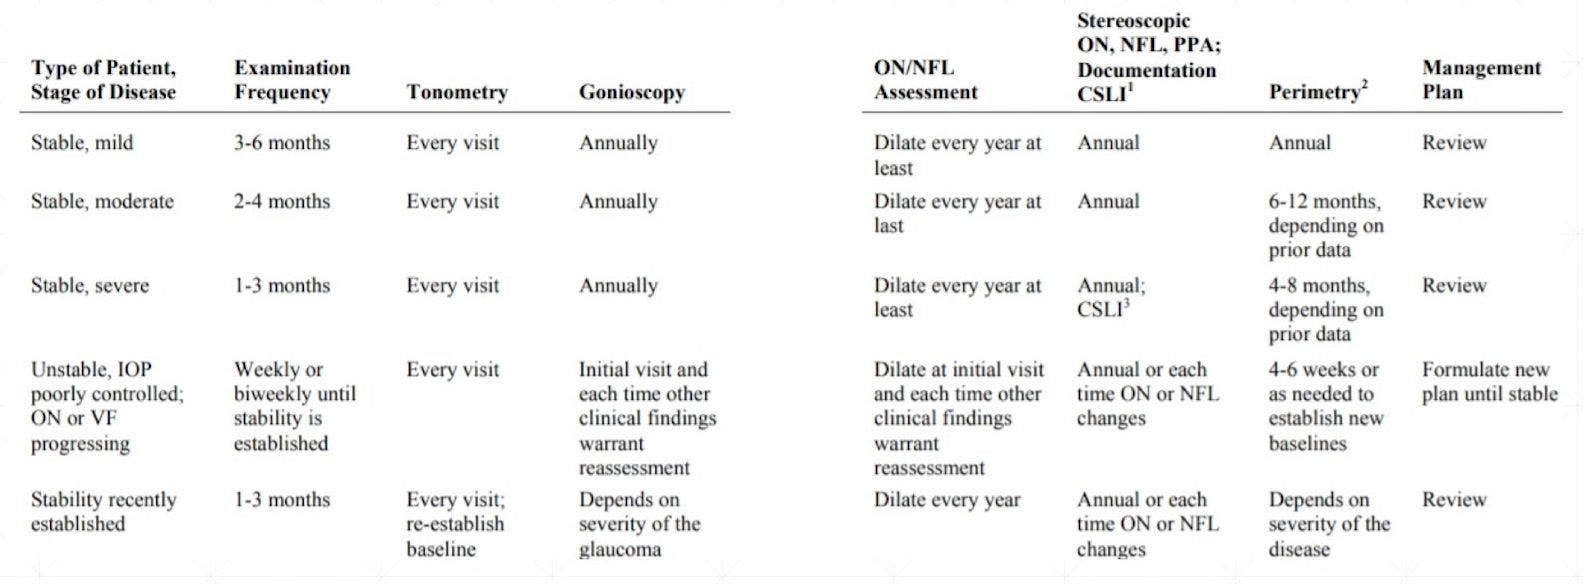
Table 1: from the AOA Glaucoma Clinical Practice Guidelines.
Evaluating Glaucoma Progression
When monitoring for glaucoma progression, it is important to consider the following factors:
Type of Progression: Is the glaucoma defect deepening? Is it widening? Is there a new defect forming in another area or in the other eye?
Age-related structural/functional loss: As we age, there is a normal loss of axons and sensitivity within our visual field. This amount of change needs to be differentiated from pathological change.
Variability: There will be variability found within the instruments used, the measurements taken and by whom. There will also be variability in the nature of the disease itself and amongst patients.
Clinical tip: ZEISS provides a guided progression analysis (GPA) which is available on the CIRRUS OCT, as well as the Humphry perimeter devices. This feature has the ability to analyze data in the context of variability to provide objective interpretation of progression. Zeiss GPA data can help guide clinicians in their management of a patient’s glaucoma. It can assist us in determining if a patient’s glaucoma is truly worsening and if so, how quickly it may be changing through its projections. This can help to make more informed choices when it comes to making changes to or introducing a new medication or treatment. The data is also able to provide insight on whether a patient may potentially experience vision loss if treatment is not increased via data extrapolation.
Clinical Cases
Case 1
Initial visit, T0
51 yo BF c/o near blur OU
BCVA 20/20 OD, OS with new PAL rx
IOP 18/19
CD OD 0.60 CD OS 0.65
BCVA 20/20 OD, OS with new PAL rx
IOP 18/19
CD OD 0.60 CD OS 0.65
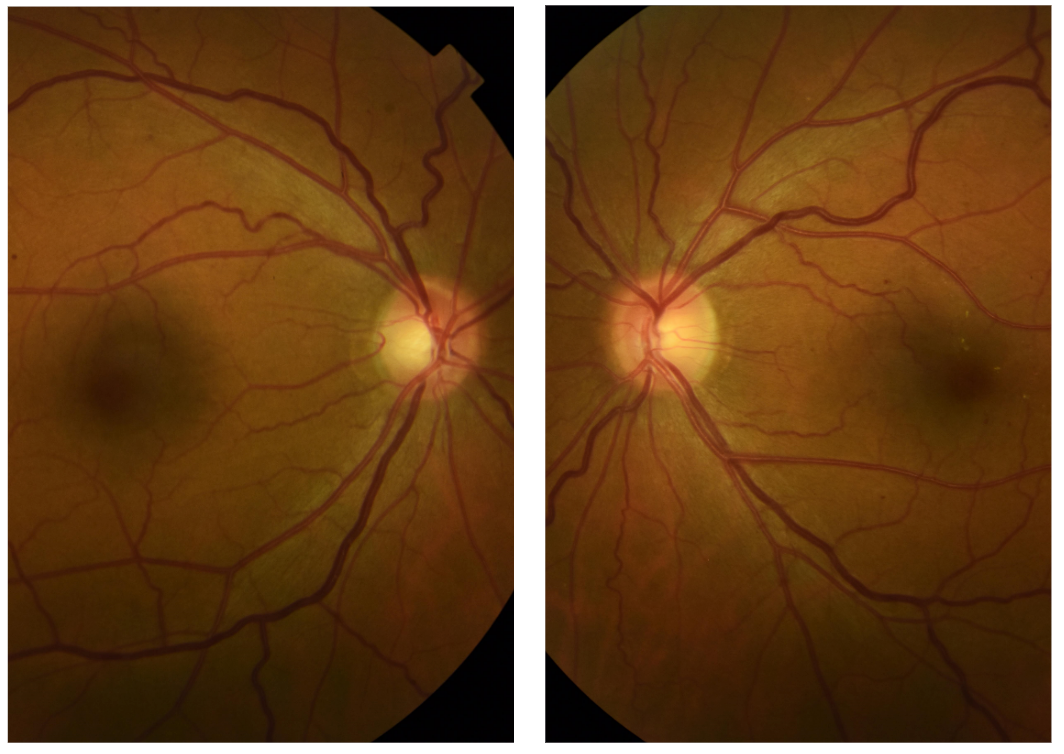
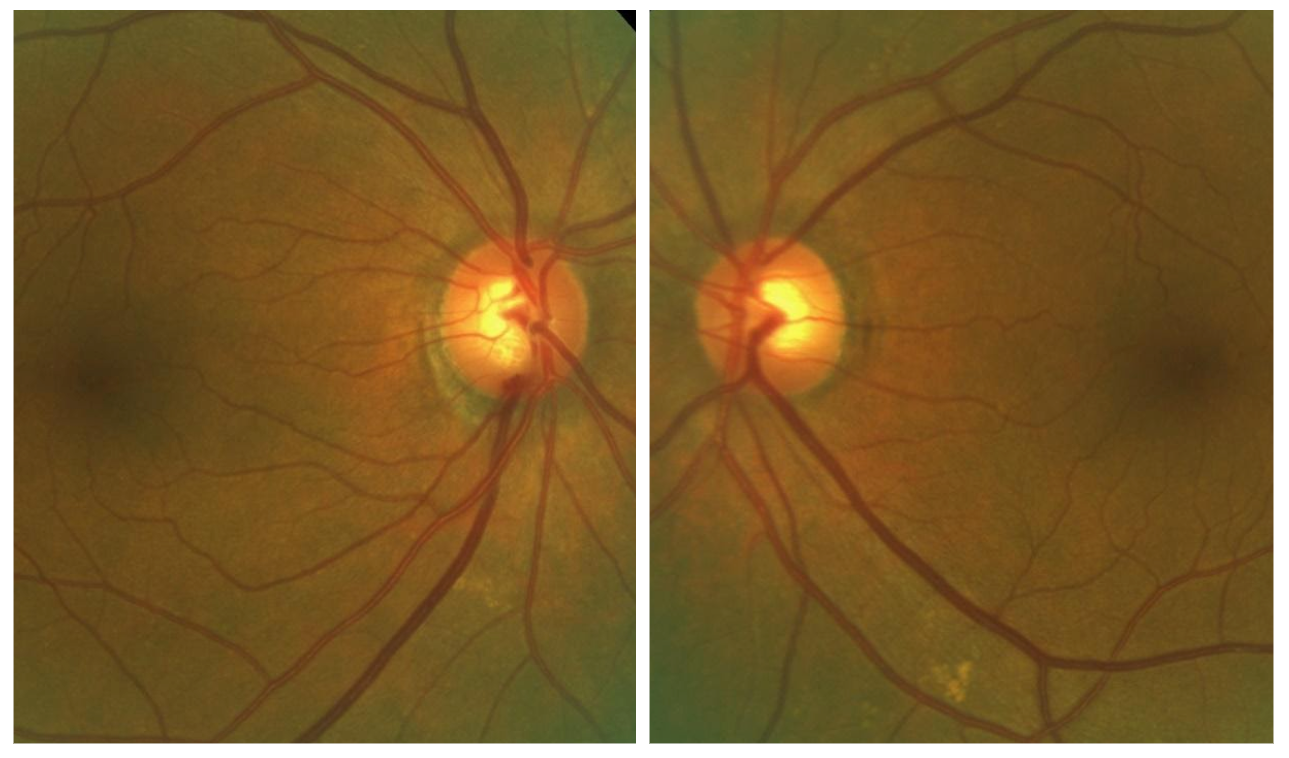
Evaluate the size of the optic nerve disc. Take a good look at the size of the disc, checking for vertical/horizontal elongation, overall disc shape and disc tilt. Then, consider the size of the cup in relation to the disc size. Evaluate the peripapillary area, check for any disc hemes and defects in the RNFL. It can be important to discern any disc pallor, which if present, may indicate possible neurological etiology.

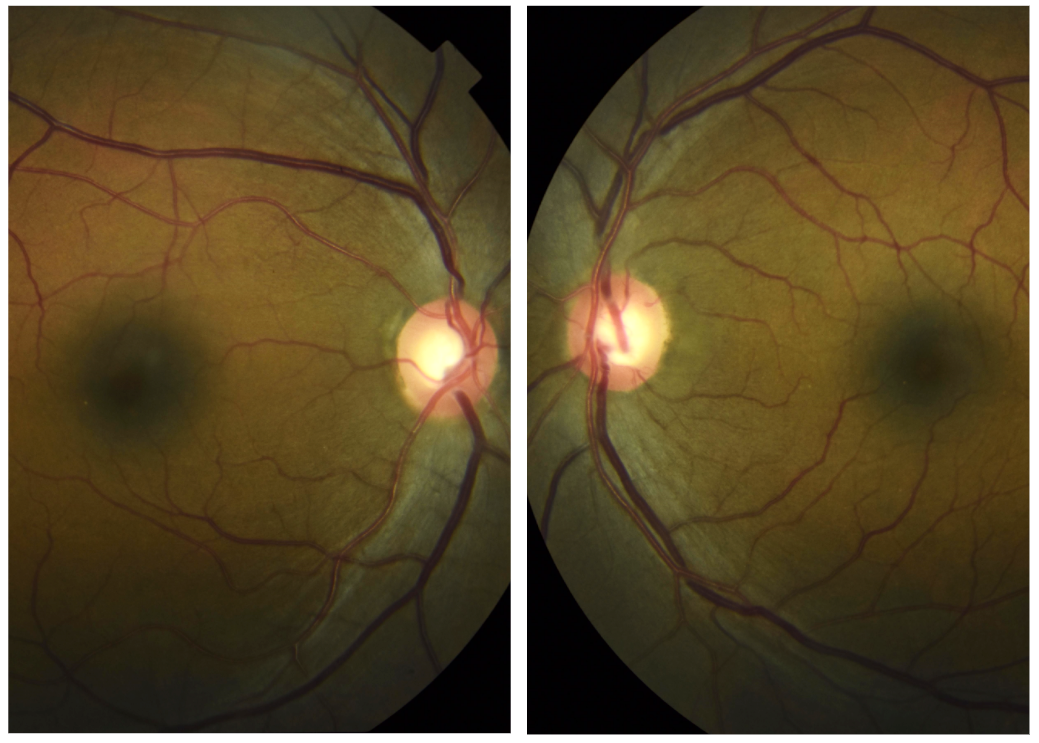
Follow up, T+3 weeks
51 yo BF presents for dr directed glc suspect f/u
IOP 17/17
Pachs 552/554
Gonio CB 360 OD, OS
IOP 17/17
Pachs 552/554
Gonio CB 360 OD, OS
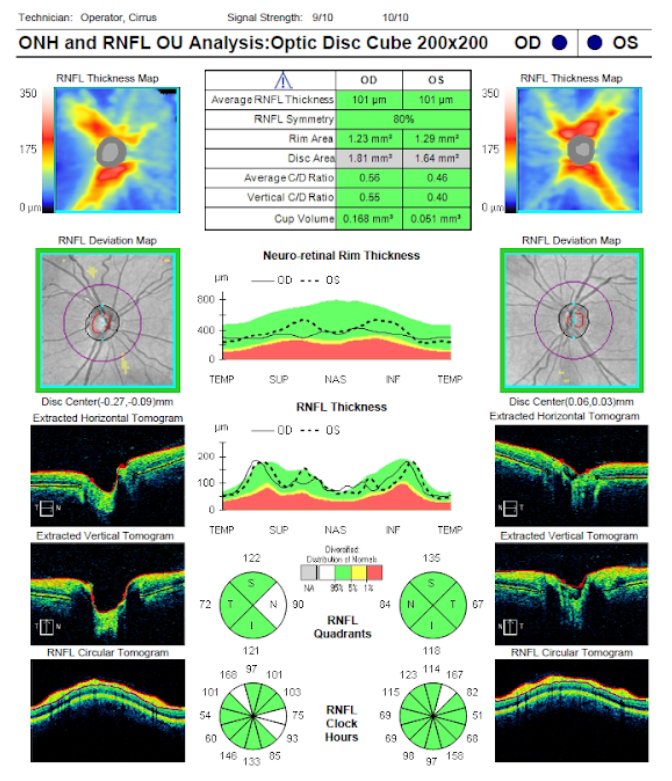
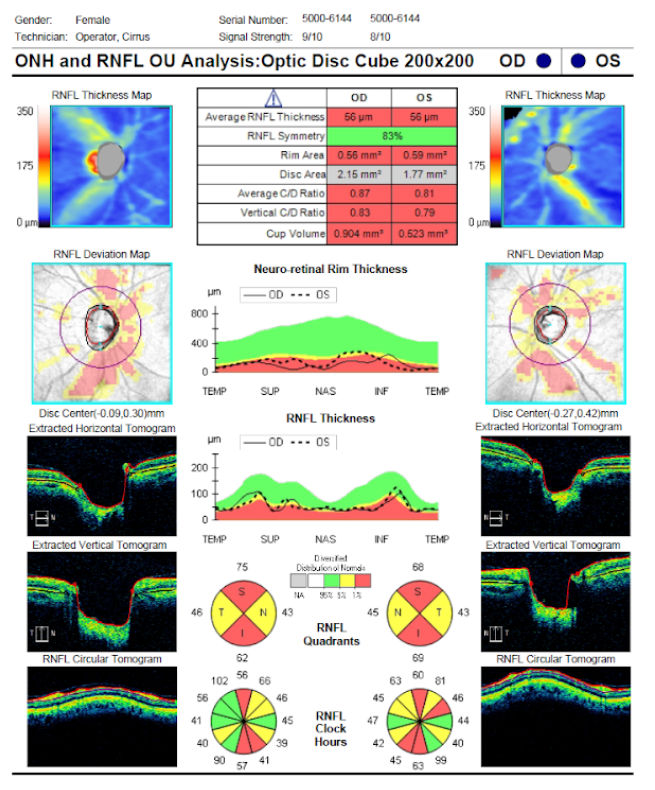
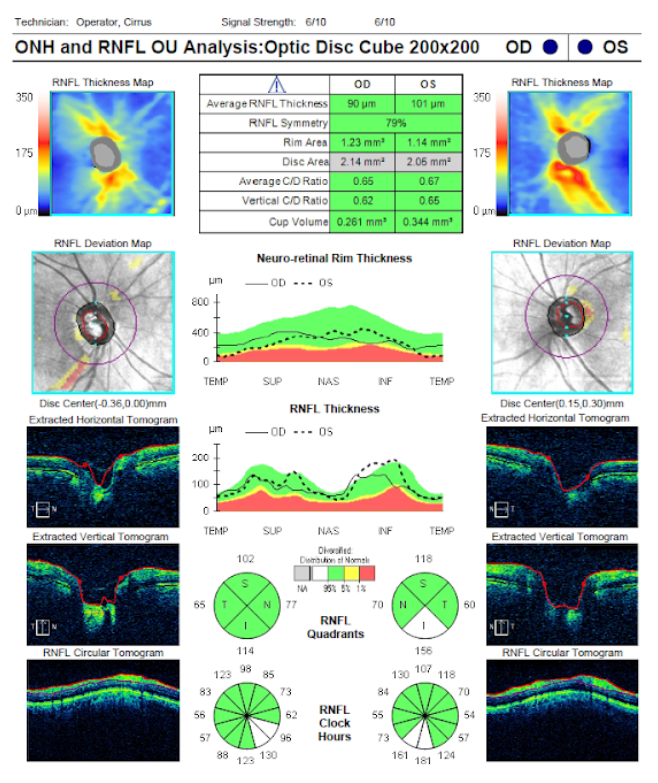
Looking at the OCT scan (of both the optic nerve and the macula), it is important to first look at the overall centration and signal strength of each scan. Next, assess the quadrants of the optic nerve to check for any potential thinning (observing color differences between green, yellow and red). Spending time evaluating the TSNIT curve and deviation map is crucial. Sometimes you may have patients with a small amount of RNFL dropout that can be missed on the TSNIT curve, but can be located on the deviation map. Therefore; it is important to analyze the results of both of these carefully.

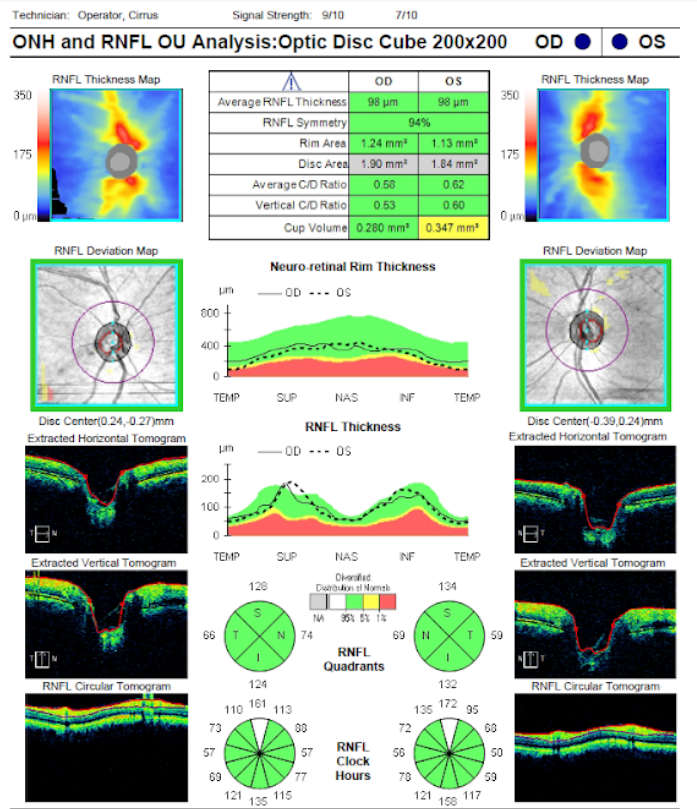
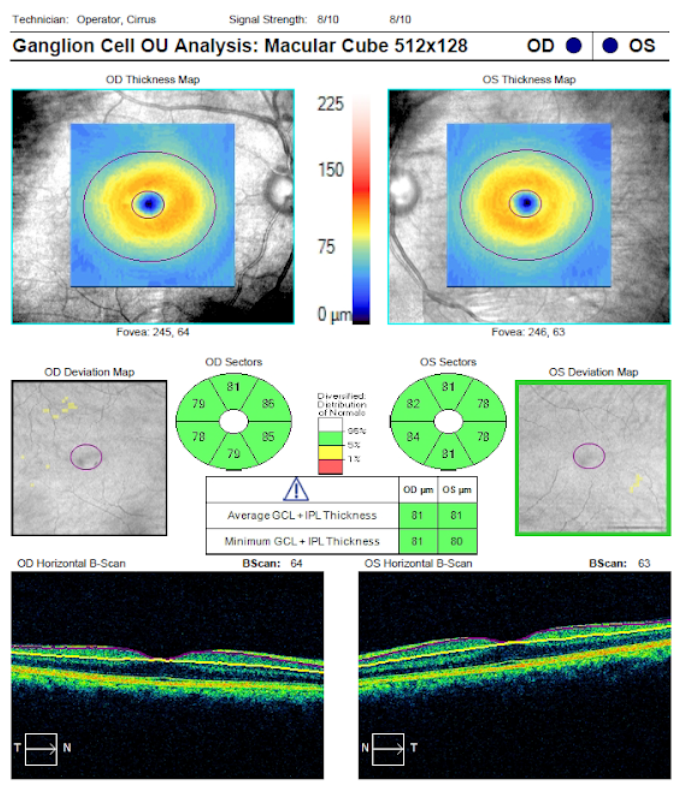
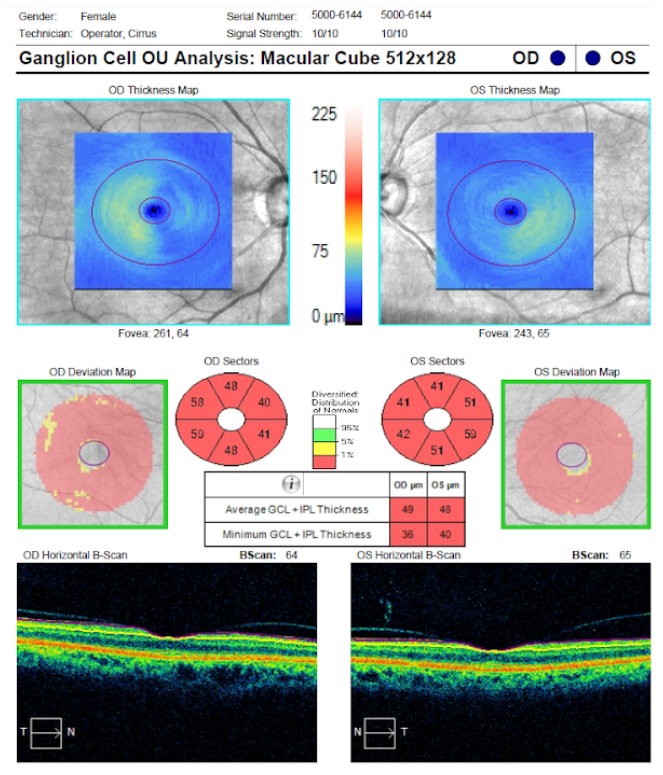
The Ganglion Cell Analysis (GCA) is useful to perform in conjunction with the RNFL scan since the location of potential RNFL changes may also show ganglion cell loss in the same quadrant of the corresponding retina, within the macular area.

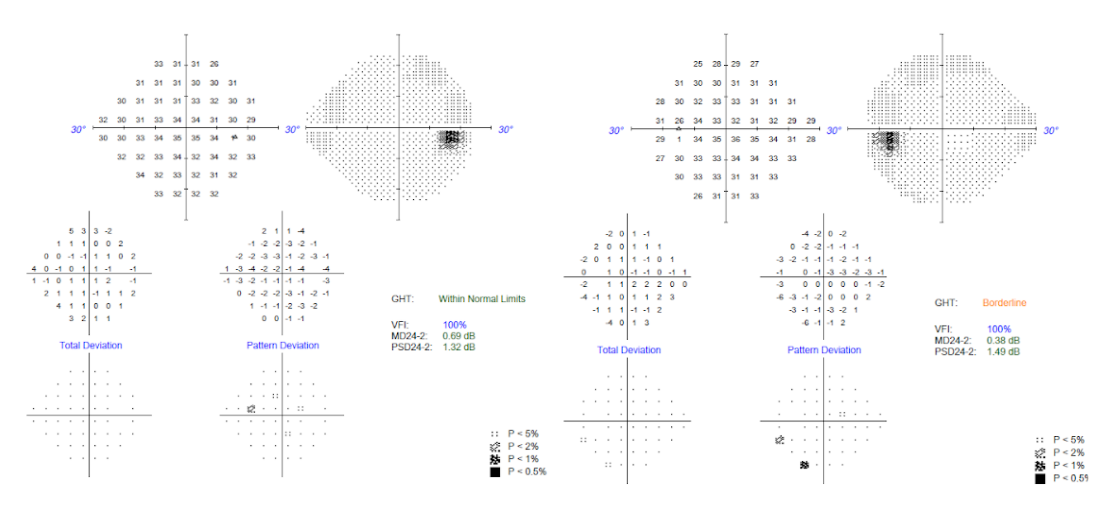
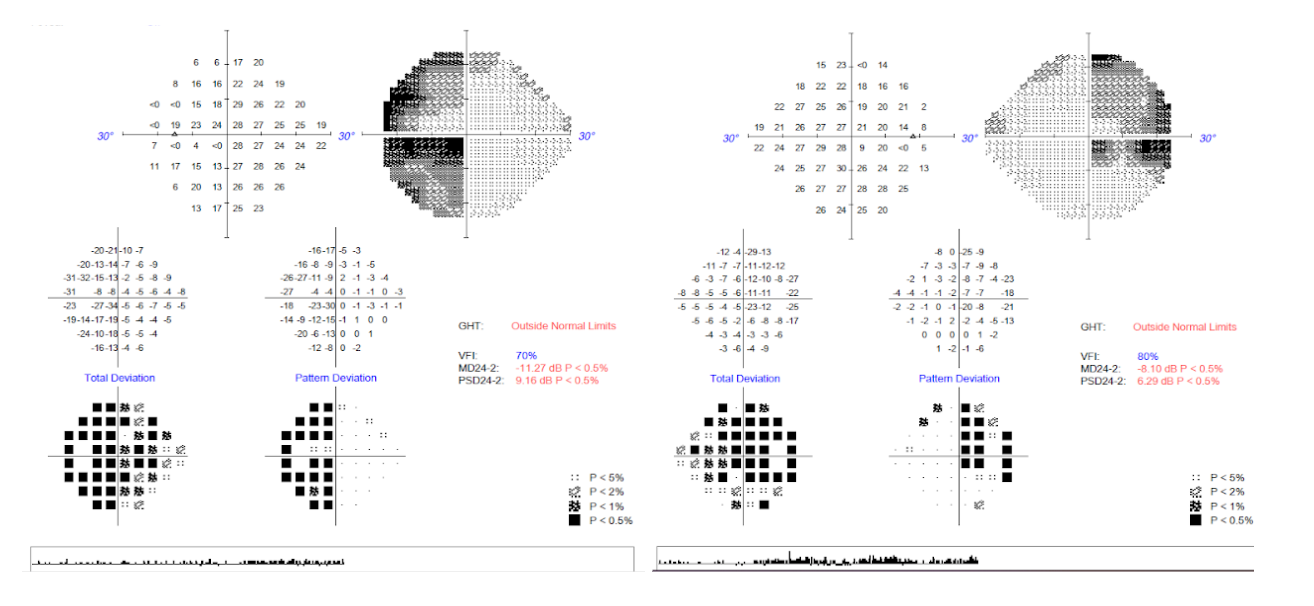
Below are the results of this patient’s first-ever visual field examination taken at their three week visit. Note that there are some defects present in the pattern deviation map. In the right eye, the defects tend to be more in the central area and for the left eye, the defects are more concentrated in the temporal region.

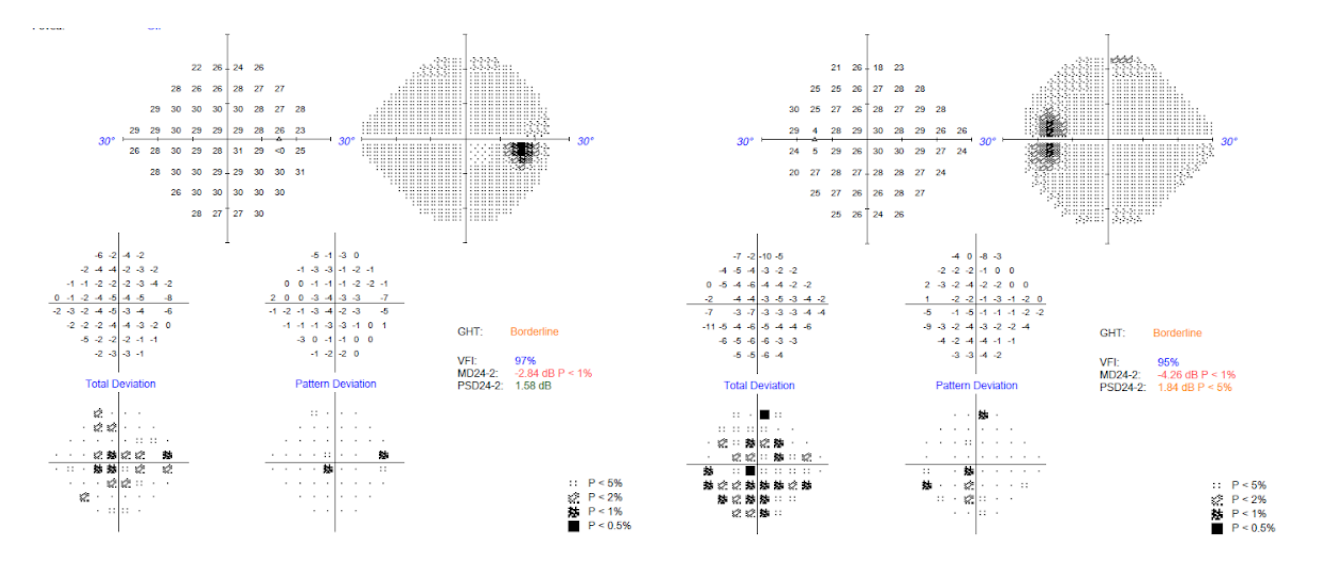

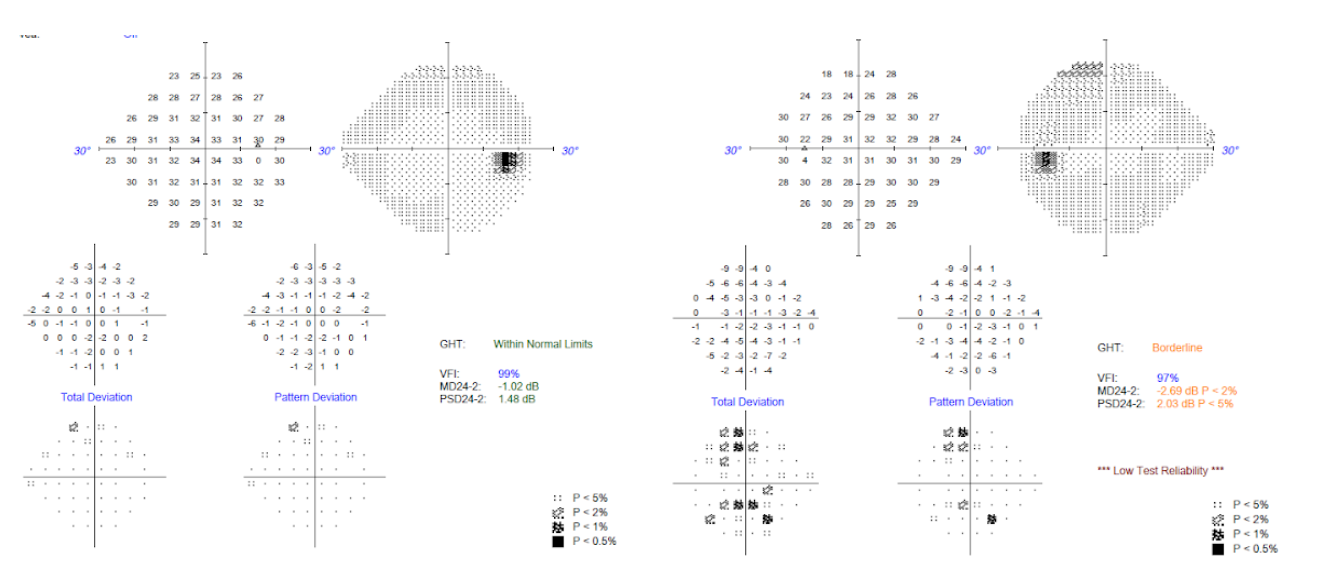

In recent literature, it has been found that macular defects, seen both on an OCT scan and the visual field, can be found in all grades of glaucoma (i.e. in early, moderate and advanced stages). When considering the “hill of vision”, the macula is the most sensitive portion within that spectrum. As there are RNFL fiber bundles that subtend toward the macula, picking up any central defect points could potentially be an early indicator of damage. It is also important to keep in mind that central vision defects can more significantly affect a patient’s overall quality of life as compared to vision defects seen peripherally.
Follow up, T+5 months
62 yo BF presents for Dr. directed glc suspect f/u.
IOP 19/19
Here for repeat 24-2 and 10-2 visual fields.
IOP 19/19
Here for repeat 24-2 and 10-2 visual fields.
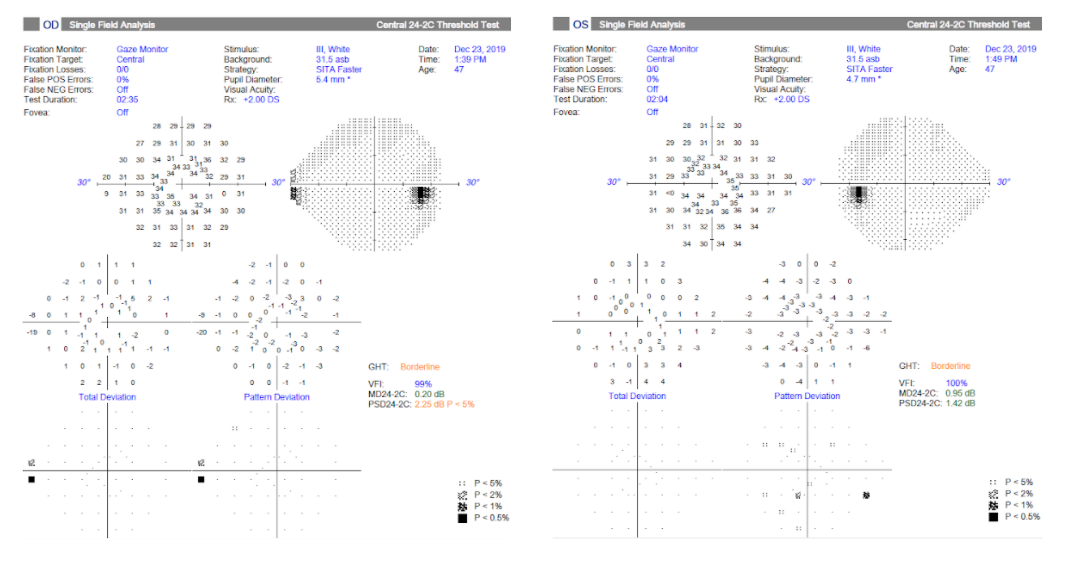
Repeat 24-2 test reveals that the right eye is looking much better, although the left eye still shows some defects.
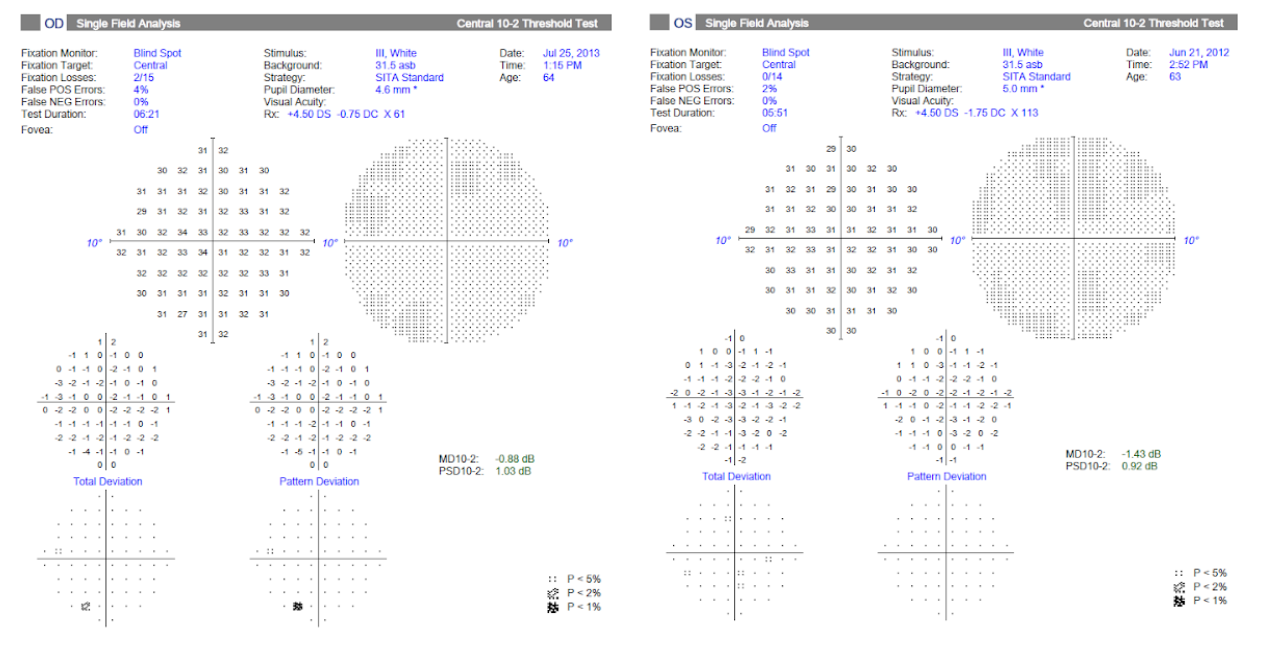
These are the results of the patient’s first 10-2 visual field test. Initially, there was concern for possible central visual field defects, as seen in the 24-2 tests. However, the 10-2 results were relatively clean and do not suggest central defects.

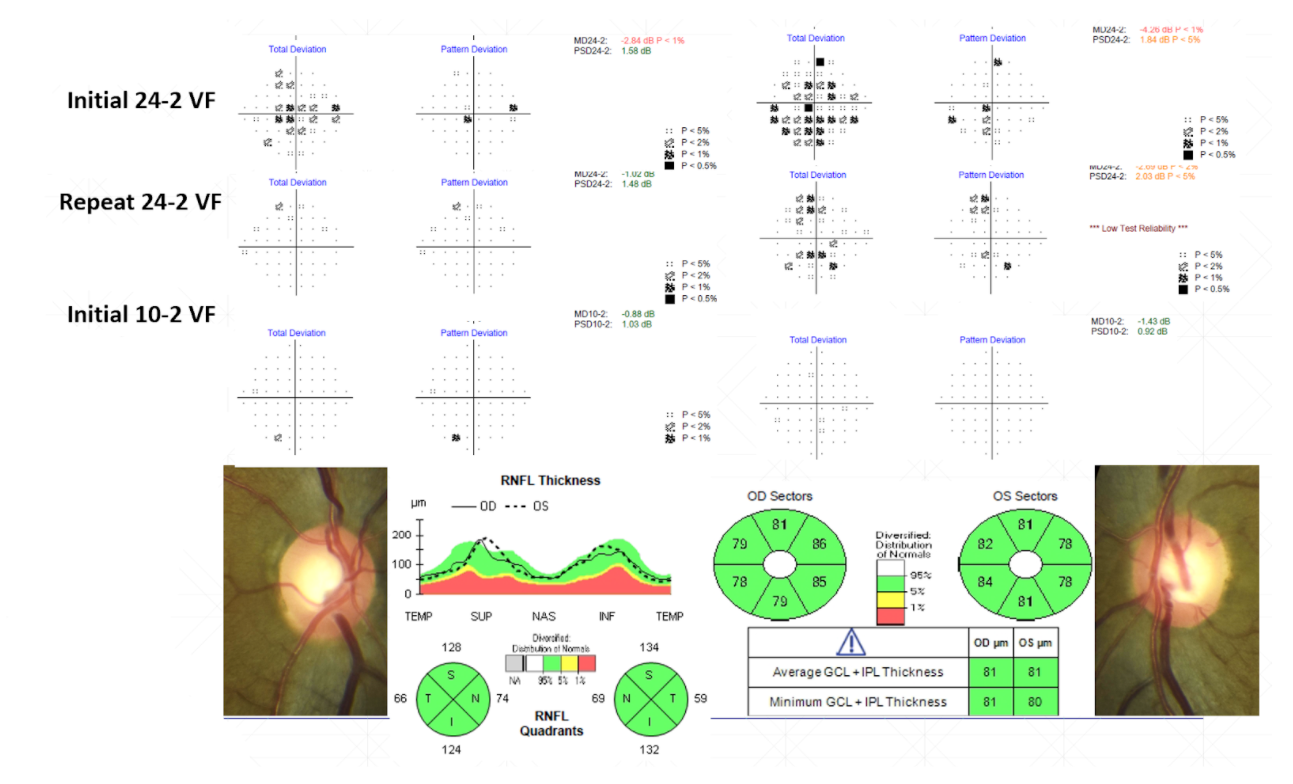
Summarizing this patient’s three visits so far, we have collected the following visual field results for their initial and repeat 24-2 tests, as well as, their initial 10-2 result. Below are the remaining pertinent findings.
- IOP1:18/19
IOP2:17/17
IOP3:19/19
Pachs:552/554
Gonio:CB360OD,OS
CDOD:0.60
CDOS:0.65
Management Plan: Follow up in 6 months for DFE, RNFLO OCT, VF. 24-2 Patient comes back for a “yearly” exam.
Case 2
Initial visit, T0
47 yo WM presents for diabetic ocular wellness exam.
No ocular complaints.
BCVA 20/20 OD, OS
IOP 23/22
CD OD 0.60/OS 0.55
No ocular complaints.
BCVA 20/20 OD, OS
IOP 23/22
CD OD 0.60/OS 0.55
Based on this patient’s CD ratios and IOPs, the patient is a glaucoma suspect. He is told to follow up within 6 weeks for VF, OCT, gonio, pachs, and IOP check.

Follow up, T+1 month
47 yo WM presents for dr directed glc suspect f/u.
FHx step-sister has glaucoma, patient determines this information after the initial visit
IOP 22/22
Pachs 524/523
Gonio Open to SS 360 OD, OS
FHx step-sister has glaucoma, patient determines this information after the initial visit
IOP 22/22
Pachs 524/523
Gonio Open to SS 360 OD, OS
The patient’s OCT scan looks quite normal. The quadrantal analysis shows only green and white and the deviation map also looks normal.

The patient’s initial visual field test came out clean, overall. There are a few spots missed inferiorly in the left eye, but these are not strongly suggestive of glaucoma.

At the conclusion of this visit, it can be said that this patient is a glaucoma suspect and repeat IOP and VFE testing will be done at the 3-month mark.
Follow up, T+4 months
44 yo WM presents for dr directed glc suspect f/u.
IOP 23/22
IOP 23/22
FHx step-sister has glaucoma
IOP(T0) 23/22
IOP(T+1month) 22/22
IOP(T+4month) 23/22
CD OD 0.60/OS 0.55
Pachs 524/523
Gonio Open to SS 360 OD, OS
IOP(T0) 23/22
IOP(T+1month) 22/22
IOP(T+4month) 23/22
CD OD 0.60/OS 0.55
Pachs 524/523
Gonio Open to SS 360 OD, OS
A 24-2C visual field was taken at this visit. This differs from the standard 24-2 visual field test in that the 24-2C also includes 10 macular points of vision.

Macular testing becomes important as macular vision defects can be present in all forms and grades of glaucoma. Though the eye pressure is slightly elevated from the most recent visit, there are no significant abnormalities seen in the deviation map of the visual field exam. Thus, after collecting several IOP and visual field results, there are no signs that indicate a high risk of glaucoma.
Having said that , his pachymetry results show a slight thinning of the cornea and he does still have moderate optic nerve cupping. Therefore, it is important to still keep an eye on these findings and monitor the patient again in 6 months for a repeat DFE, RNFL OCT and VFE.
Case 3
Initial visit, T0
32 yo HF presents for ocular wellness exam.
No ocular complaints.
BCVA 20/20 OD, OS
IOP 16/16
CD OD 0.80/OS 0.75
No ocular complaints.
BCVA 20/20 OD, OS
IOP 16/16
CD OD 0.80/OS 0.75
Due to the optic nerve cupping seen in both eyes (slightly more cupping in the right eye), this patient is a glaucoma suspect and is asked to return for a follow up in a few weeks for additional testing.

Follow Up, T+3weeks
32 yo HF presents for dr directed glc suspect f/u
BCVA 20/20 OD, OS
IOP 17/17
Pachs 580/574
Gonio CB 360 OD, OS
CD OD 0.80/OS 0.75
BCVA 20/20 OD, OS
IOP 17/17
Pachs 580/574
Gonio CB 360 OD, OS
CD OD 0.80/OS 0.75
At this visit, although the IOP, gonioscopy and pachymetry results were within normal limits, the RNFL OCT and GCA analysis show significant thinning both around the optic nerve and macula in both eyes. The quadrantal chart appears as a mix of red and yellow, indicating significant thinning. The deviation map also reveals that thinning for both eyes is occurring more prominently in the nasal region as opposed to the temporal side. Typically, with glaucoma, the opposite situation is observed (the temporal margin of the optic nerve is found to be thinner than the nasal).


The visual field test taken at this visit reveals a bitemporal field defect in each eye, which further confirms that this is highly unlikely to be glaucoma, as glaucoma field defects tend to respect the horizontal midline.

Overall, since the changes observed in this patient do not align with the changes typically seen in glaucoma patients, it is now essential to consider other possible causes for this presentation. For this patient, non-glaucomatous optic neuropathy is suspected due to a potential space-occupying lesion (I.e., a pituitary tumor) and an MRI is warranted as the next step.
MRI revealed that this patient did in fact have a pituitary macroadenoma which was surgically removed with success. Her visual field drastically improved and her vision remained 20/20 in each eye. Considering the extensive thinning that was seen centrally on her macular OCT, it indicates that the tumor was likely there for quite some time and therefore she is quite fortunate to still have such a great visual outcome post-surgical removal of the tumor (ref v).
Case 4
Initial visit, T0
65 yo BM c/o near blur
BCVA 20/20 OD, OS
IOP 21/19
CD OD 0.70/OS 0.60
(+)Disc heme OD
BCVA 20/20 OD, OS
IOP 21/19
CD OD 0.70/OS 0.60
(+)Disc heme OD
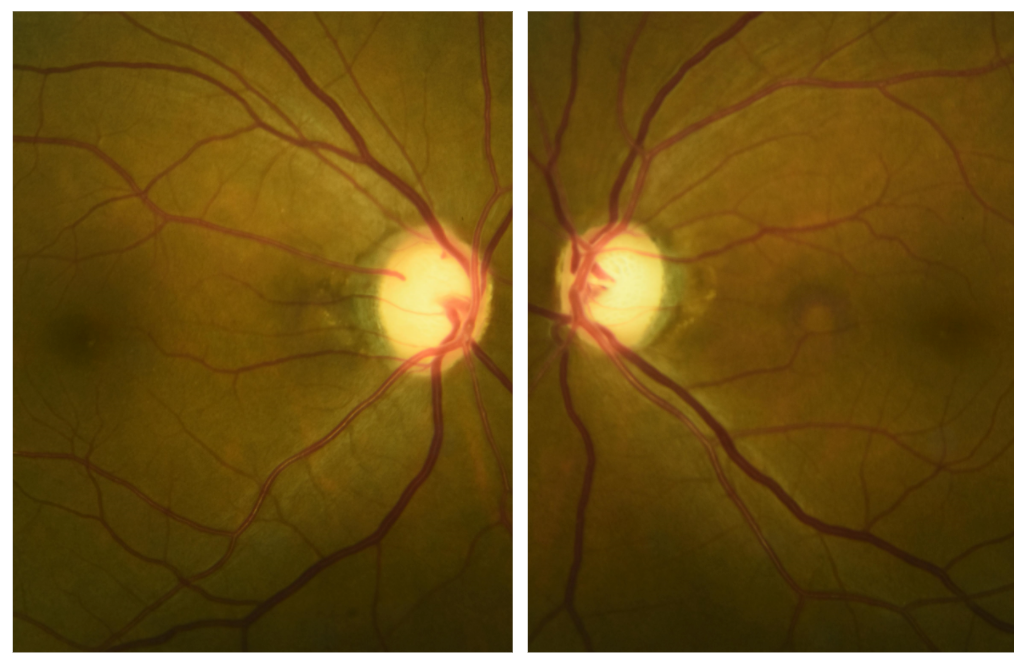
This patient’s fundus photos reveal disc hemorrhages in the right eye. Often, disc hemes that are somewhat camouflaged with the rest of the vessels near the disc are overlooked or completely missed. This patient is a glaucoma suspect due to the large optic nerve cupping and is asked to return for a follow up in 6 weeks for VFE, OCT, gonioscopy, pachymetry and another IOP test.

Follow up, T+4 weeks
65 yo BM presents for dr directed glc suspect f/u
IOP 24/21
Pachs 534/540
Gonio SS 360 OD, OS
IOP 24/21
Pachs 534/540
Gonio SS 360 OD, OS
Taking a look at the quadrantal graph on this patient’s OCT, although all quadrants of both eyes appear to be green or white, it important to note that the inferior quadrant of the right eye shows a thickness value of 114 microns while the inferior quadrant shows an inferior thickness of 156 microns in the left eye. This difference in thickness levels between the two eyes is also seen in RNFL and deviation maps inferiorly. This reveals that even though the OCT scan may reveal thickness levels in the “green” range (which typically corresponds to a within-normal amount of thickness), it is still important to consider the relative thickness when comparing one eye to another. With this patient, the right eye’s inferior quadrant is relatively thinner than the left eye’s and that is also the same quadrant where the disc hemorrhage was seen on the fundus photo.

Consequently, the visual field test shows a superior nasal step in the patient’s right eye, corresponding to the disc heme and relative thinning seen on the fundus photo and OCT inferior temporally.

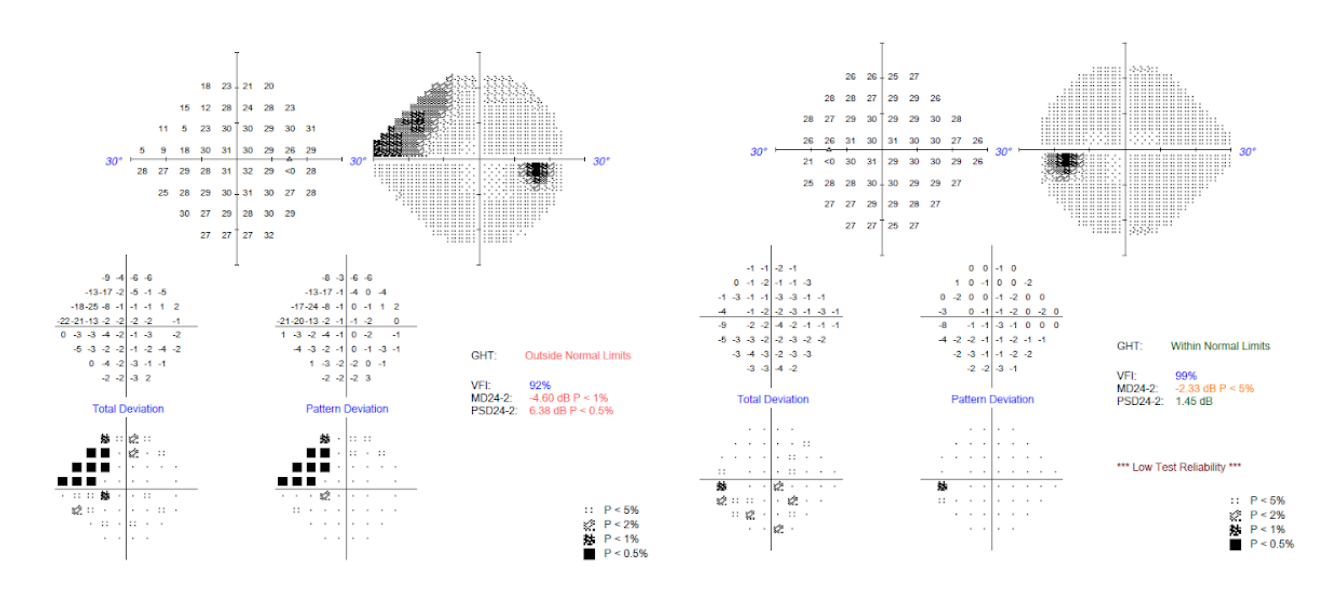
Based on these changes seen on initial OCT and VFE, it is evident that this patient has glaucoma. The patient was advised that the next visit would be within 1-3 weeks for an additional pressure check and that treatment would be started at that visit regardless. It is important to gather several IOP readings in order to determine what a patient’s Tmax will be and how to determine their target or goal IOP.
Additional Cases and Discussion Points
Conclusion
When it comes to educating your patient on your clinical findings, having a discussion with your patient beforehand to let them know that treatment will be initiated at their next visit can prevent them from becoming overwhelmed with the information being presented to them. Giving them time to think and prepare for their next visit can aid them psychologically as they begin to comprehend that glaucoma is a lifelong condition and will need to be managed as such. Their quality of life can certainly remain intact for many years to come if treatment and management are maintained appropriately both by the clinician and the patient.
References
- Epshtein Daniel, Laul Anupam (2020). A practical approach to Glaucoma Webinar.
- Epshtein Daniel, Laul Anupam (2020). A practical approach to Glaucoma Powerpoint.

