


Optical Coherence Tomography (OCT) is the single greatest innovation in ophthalmic imaging within the last two decades. OCT technology has revolutionized and continues to influence how eyecare practitioners examine patients and manage diseases. Simple thickness measurements of the macula and peripapillary retinal nerve fiber layer have evolved into sophisticated analyses of the retina, ganglion cells, optic nerve, and anterior segment.
Now optical coherence tomography angiography (OCT-A) with ZEISS CIRRUS AngioPlex® opens up a whole new ophthalmic frontier with noninvasive imaging of the retinal and choroidal vasculature.
How does OCT-angiography work?
OCT-A takes advantage of motion-based variance within sequential OCT images to create high-resolution images of retinal and choroidal vasculature. Using FastTrac™ Eye Tracking Technology, each OCT scan is repeated up to four times in rapid succession at the same location. Because retinal tissue doesn’t move over the course of a few milliseconds, the only difference between the four scans should be the movement of red blood cells within vessels. The location of moving red blood cells is then used to create vasculature images called OCT angiograms.
Unlike standard retinal OCT scans which are analyzed in cross-sectional manner, OCT-A scans are presented as enface slabs. A single OCT-A scan provides both vascular OCT-A data and structural OCT data that can be analyzed together at the same time.
What will you see with ZEISS CIRRUS AngioPlex®?
The ZEISS CIRRUS AngioPlex images retinal and choroidal vasculature in three sizes: a 3x3mm, 6x6mm, and 8x8mm square protocol. The 3x3mm scan size has the smallest field of view but the greatest resolution, allowing for precise imaging of small vascular details. As the scan size increases to 6x6mm and 8x8mm, the resolution decreases while field of view increases. For foveal diseases, it can be most convenient to use the 3x3mm scan, but in cases of diffuse vascular anomalies, it may be useful to use the 8x8 scan protocol accompanied by the 3x3 in specific areas of interest. For wide-scale vascular pathologies, a 14x14mm montage can be created.

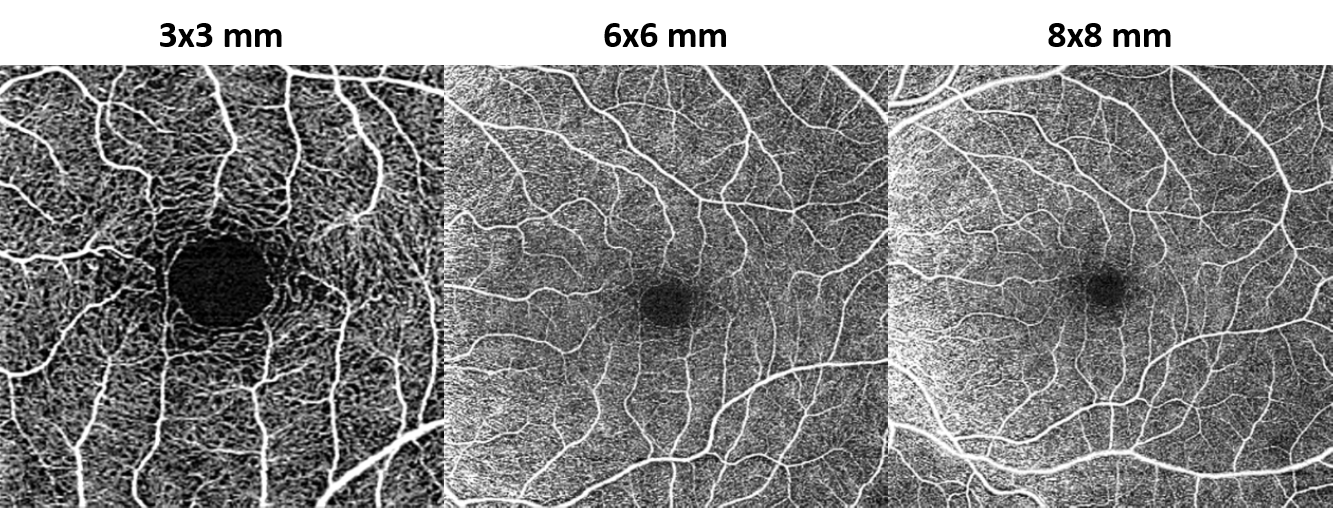
Figure 1: OCT-A images taken on the ZEISS CIRRUS AngioPlex at three different scan sizes.**
To improve image resolution and minimize movement artifacts, the CIRRUS AngioPlex incorporates FastTrac Eye Tracking Technology. FastTrac 3.0 is designed to not only eliminate eye motion within a single scan, but to also ensure that the same precise location on the retina is scanned from visit to visit. FastTrac incorporates improved eye-tracking capabilities that eliminate more motion artifacts than in the past, which means higher quality images and a faster workflow.
Visualize vasculature with dye-based angiography
Fluorescein angiography (FA) and indocyanine green angiography (ICGA) have been the gold standards for evaluation of retinal and choroidal vasculature, respectively. These imaging modalities visualize vasculature by taking advantage of dye diffusion dynamics and excitation properties of two injectable dyes: fluorescein sodium in FA and indocyanine green in ICGA. After injection of the appropriate dye into the antecubital vein, an imaging platform (fundus camera or scanning laser ophthalmoscope) with appropriate excitation wavelengths and barrier filters is used to capture images of the retinal, choroidal, optic nerve head, or anterior segment vasculature. The dye follows a time-based diffusion sequence and is eventually eliminated from the blood. Circulation time (delayed or expedited), hyperfluorescence, hypofluorescence, and lesion staining during various stages of the angiogram can help identify edema, neovascularization, capillary dropout, and other pathology. Though severe complications such as anaphylaxis are rare, more mild complications such as nausea occur in up to 5% of patients.
How does OCT-A compare to FA and ICGA?
Though both OCT-A and dye-based techniques visualize ocular vasculature and provide images which seem similar, they are not interchangeable. Whereas OCT-A is based on erythrocyte movement, FA/ICGA rely on the diffusion of an injectable dye dissolved within blood plasma or bound to blood proteins. Due to the photographic nature of FA/ICGA, it is impossible to determine the depth of a particular signal (or lack thereof) without context clues derived from ophthalmoscopy or dye circulation time. Furthermore, in later stages of the FA/ICGA, lesions may become obscured due to the extravascular dye accumulation. Because OCT-A is derived from OCT B-scans (the typical OCT slices that we are accustomed to evaluating), every OCT-A image is depth encoded. With OCT-A, vessel information can be localized to specific layers of the retina and choroid, just like with standard structural OCT. Since serous fluid exuded by defective blood vessels is not visualized with OCT-A, the exact location and morphology of microaneurysms and neovascularization is readily identifiable. OCT-A is particularly suited for foveal imaging because it does not require an excitatory signal, which is often blunted by the foveal pigments. In many cases, OCT-A and FA/ICGA are additive imaging techniques that can improve patient management.
OCT-A relies on the movement of erythrocytes within blood vessels. As a result, it cannot image serous fluid and is affected by movement artifacts more than FA/ICGA. With ever-improving software updates such as FastTrac, motion artifacts are becoming less of a concern as OCT-A imaging evolves.
Like OCT imaging, OCT-A is noninvasive and can acquire an OCT-A image in seconds. When using the higher resolution scans, OCT-A will most often reveal small vascular details in greater resolution than FA/ICGA. Meanwhile, FA/ICGA requires an injection, significant preparation, and a considerable time investment.
How to interpret OCT-angiography results
Unlike traditional OCT image analysis which relies heavily on the visualization of pathology within a B-scan image, OCT-A images are analyzed using enface slabs. Due to the numerous prebuilt enface slabs that come with the ZEISS CIRRUS AngioPlex, it is easy to focus on the vascular pathology that is most consistent with the suspected disease process. For example, when evaluating for choroidal neovascularization in a case of age-related macular degeneration, it is not necessary to evaluate vasculature within the vitreoretinal interface. In fact, concurrent viewing of superficial vasculature may confound detection of outer retinal vascular and choroidal disease.
As with any innovation, whether it is a new phoropter, new medication, or new imaging device, there is always a mix of apprehension and excitement. How do I use this? What patients should I use this on? What do these results mean? When it comes to the integration of a new imaging device into my practice, my first goal is to figure out what normal looks like. I image as many normal patients as possible, often starting with my staff and fellow doctors. I create a reference normal image to act as my imaging standard for future comparisons. I strongly believe that to accurately detect pathology, one must truly understand what normal is first.
To make it easy for our readers, I have added my standard reference of the various OCT-A enface slabs in 3x3mm, 6x6mm, and 8x8mm.

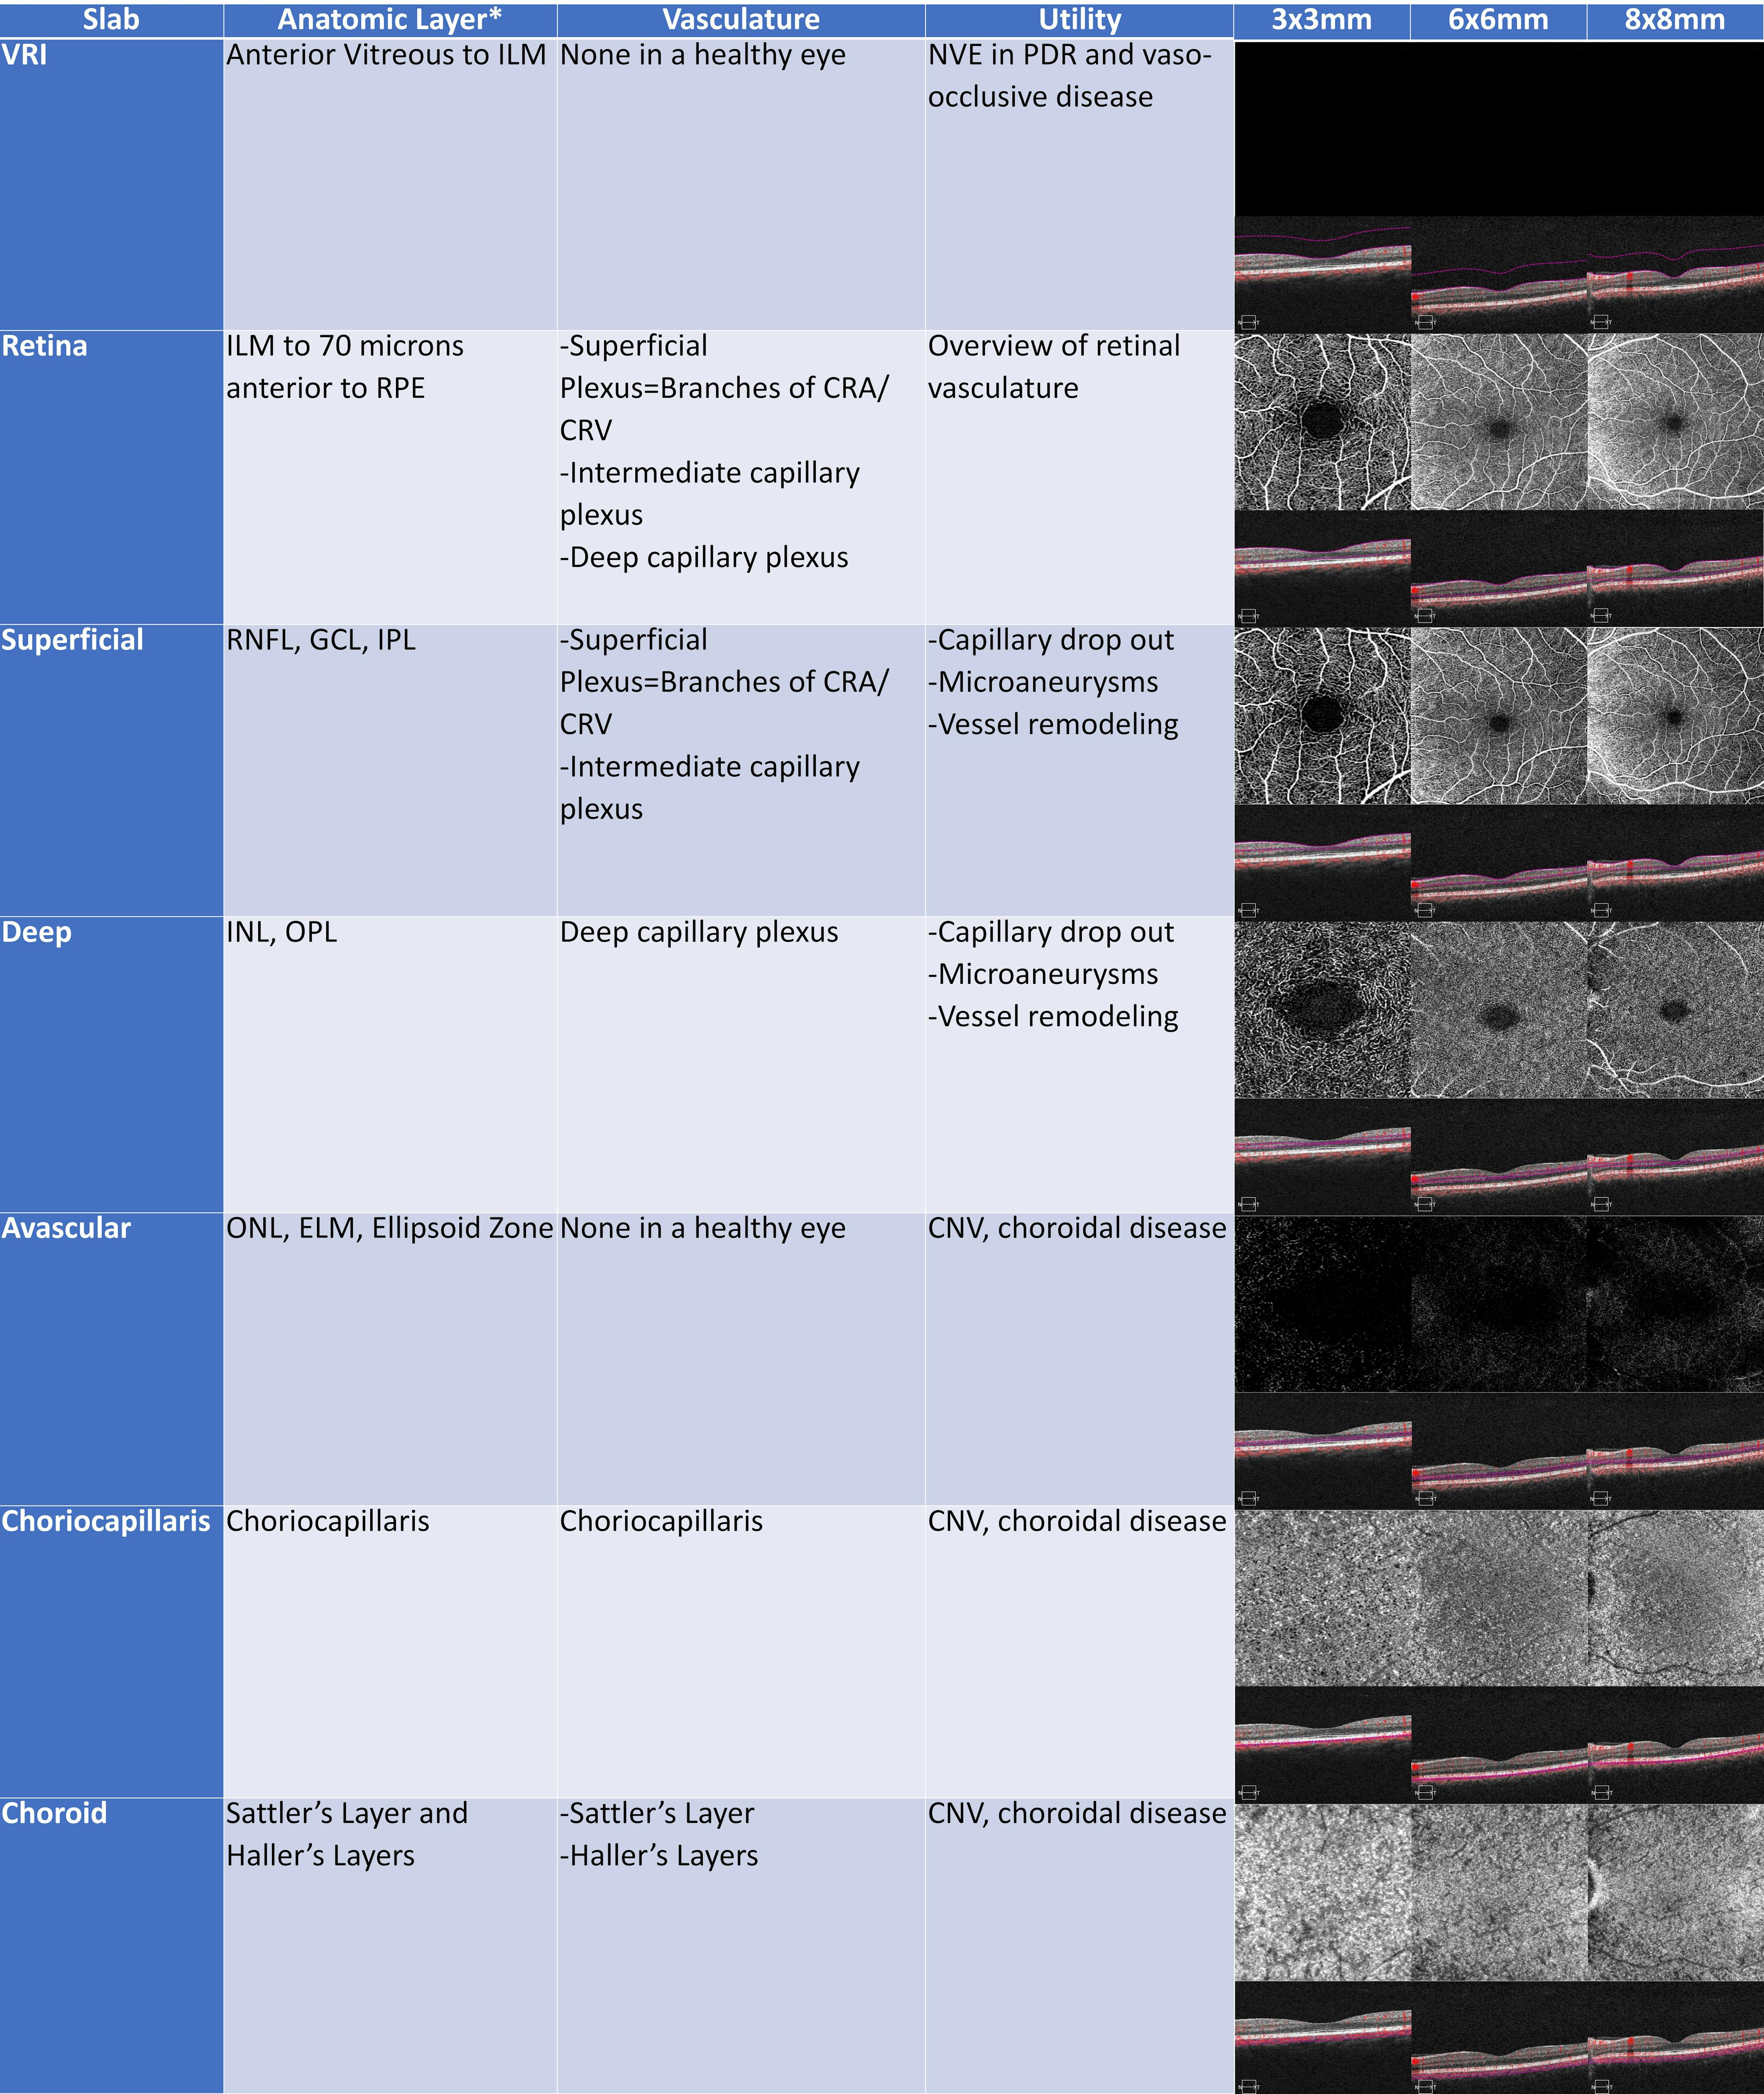
Figure 2: A standard reference of the preinstalled OCT-A enface slabs in 3x3mm, 6x6mm, and 8x8mm scans.
*Estimated anatomic layer
ILM: internal limiting membrane; NVE: neovascularization elsewhere; PDR: proliferative diabetic retinopathy; RPE: retinal pigment epithelium; RNFL: retinal nerve fiber layer; GCL: ganglion cell layer; IPL: inner plexiform layer; INL: inner nuclear layer; OPL: outer plexiform layer; ONL: outer nuclear layer; ELM: external limiting membrane; CNV: choroidal neovascularization
Though it is possible to create custom enface slabs, the many preinstalled Angioplex enface slabs are highly diagnostic in the multitude of vascular conditions, rendering customization virtually unnecessary. Each prebuilt slab has its own purpose and is a unique tool in the clinician’s armamentarium. The prebuilt enface slabs are fairly consistent over a wide range of patients, allowing for easy comparisons between two angiograms. As with structural OCT scans, the ZEISS CIRRUS is able to align two scans from different days to facilitate side-by-side analysis.
The CIRRUS AngioPlex extracts vascular information from structural data and presents both in a readily digestible format. Each enface slab has the corresponding OCT structural scan below for evaluation of retinal loci using both scan types. This is incredibly useful when evaluating a vascular lesion noted with ophthalmoscopy.
What does OCT-A mean for diabetic retinopathy?
Chronic hyperglycemia in diabetic mellitus results in retinal microvascular changes such as pericyte loss, increased vascular permeability, vascular occlusion, and fibroglial proliferation. In the advanced stages, these complications manifest as macular edema, macular ischemia, vitreous hemorrhage, and tractional retinal detachment; the most common causes of vision loss in diabetic patients.

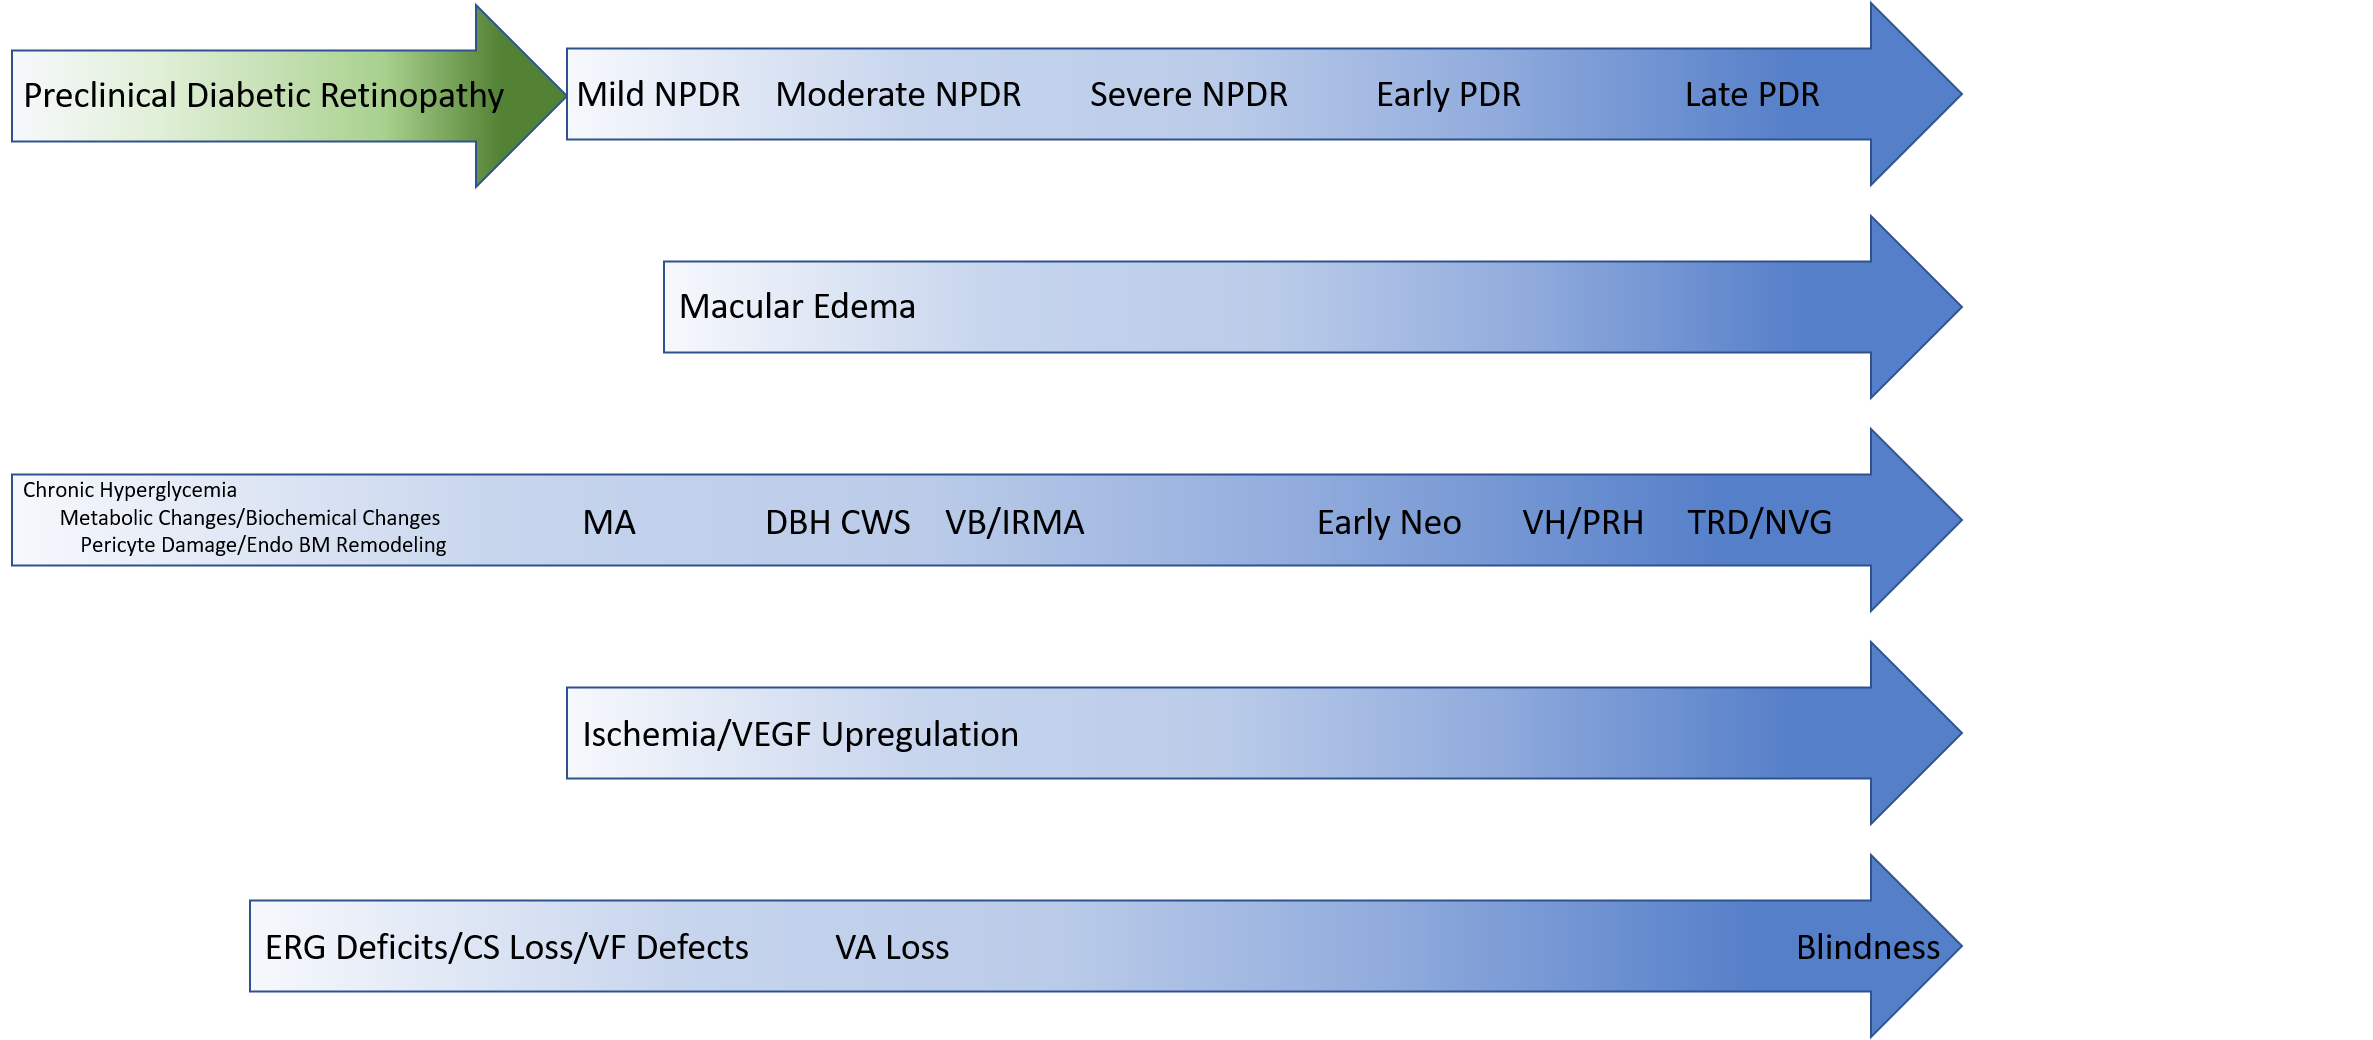
Figure 3: Chronic hyperglycemia in diabetic mellitus results in concurrent retinal microvascular, functional, and biochemical changes that can eventually lead to blindness.
The earliest preclinical signs of diabetic retinopathy, including pericyte loss and vascular basement membrane thickening cannot be visualized with funduscopy. However, early changes in macular vessel density and foveal avascular zone (FAZ) size/shape can be imaged with OCT-A before any clinical signs such as microaneurysms and hemorrhages are noted.1,2 FA and OCT-A can image microaneurysms that are not seen during fundoscopy, though it is unknown at this time if these microaneurysms should be considered in diabetic retinopathy grading.3 These changes may coincide with functional deficits noted with retino-electrophysiological testing and perimetry.

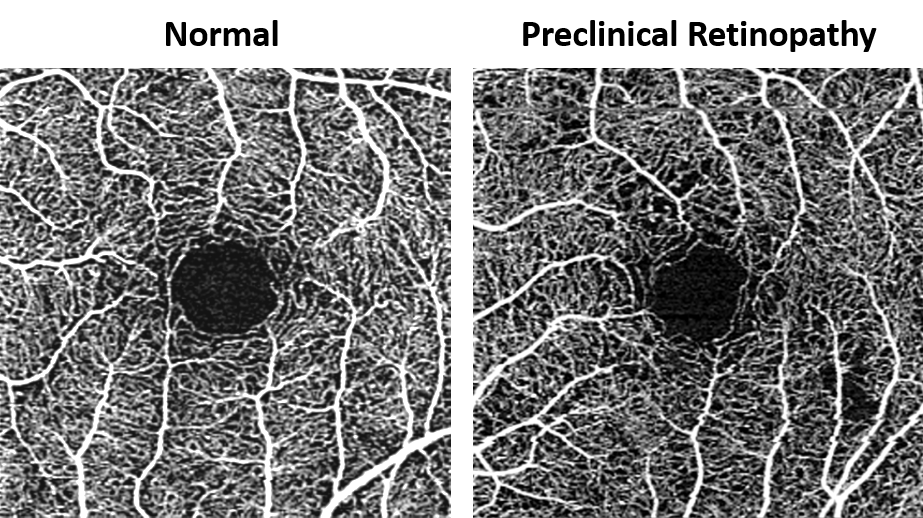
Figure 4: Preclinical nonproliferative diabetic retinopathy. The earliest signs of diabetic retinopathy are FAZ alteration, nonperfusion, and functional deficits which cannot be detected with funduscopy.
The earliest clinical sign of diabetic retinopathy is the formation of focal dilatations of the vascular wall of capillaries, small arterioles, or small venules called microaneurysms. Microaneurysms form in areas of pericyte loss via hemodynamic changes and vascular endothelial proliferation. Clinically, microaneurysms appear as small red dots 25-100μm in diameter, within the posterior pole. Early on, microaneurysms are most often noted perifoveally and may have considerable turnover, with cycles of resolution and formation. Patients with extensive microaneurysm turnover are more prone to the development of diabetic macular edema and may need to be monitored more closely.4 Microaneurysms can be visualized with OCT-A as hyperreflective dilatations of small vessels. Due to proprietary flow velocity cutoffs, microaneurysms with very slow or very fast flow may not be detected with OCT-A.
The FAZ will be enlarged and more eccentric in diabetic patients with NPDR than in those without retinopathy. These changes in the FAZ represent diabetic retinal degeneration and may correlate with decreased contrast sensitivity or suggest the need for tighter glycemic control. The FAZ is best visualized with the retina slab because microaneurysms will always be found within the retina.
Further microvascular damage leads to worsening vaso-obliteration, vascular remodeling, and hemorrhages. Intraretinal hemorrhages are usually the result of ruptured microaneurysms or leaking intraretinal microvascular abnormalities and capillaries.
FAZ degeneration and increasing areas of nonperfusion can be mapped out with OCT-A and compared to previous scans to determine the risk of worsening disease and neovascularization. In cases with significant hemorrhaging, OCT-A can be useful in distinguishing intraretinal hemorrhaging from neovascularization.

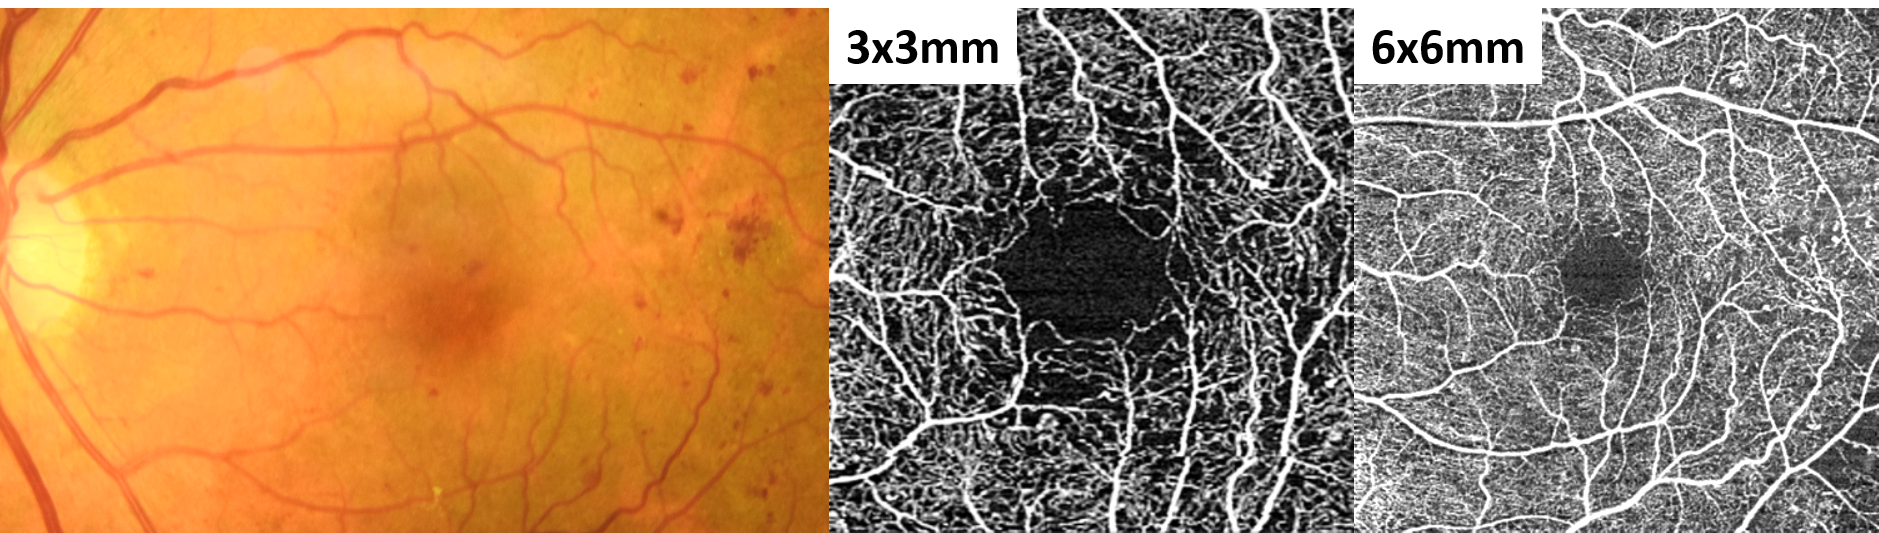
Figure 5: FAZ degeneration, microaneurysms, and areas of nonperfusion can be seen perifoveally on the 3x3mm scan and more peripherally on the 6x6mm scan.

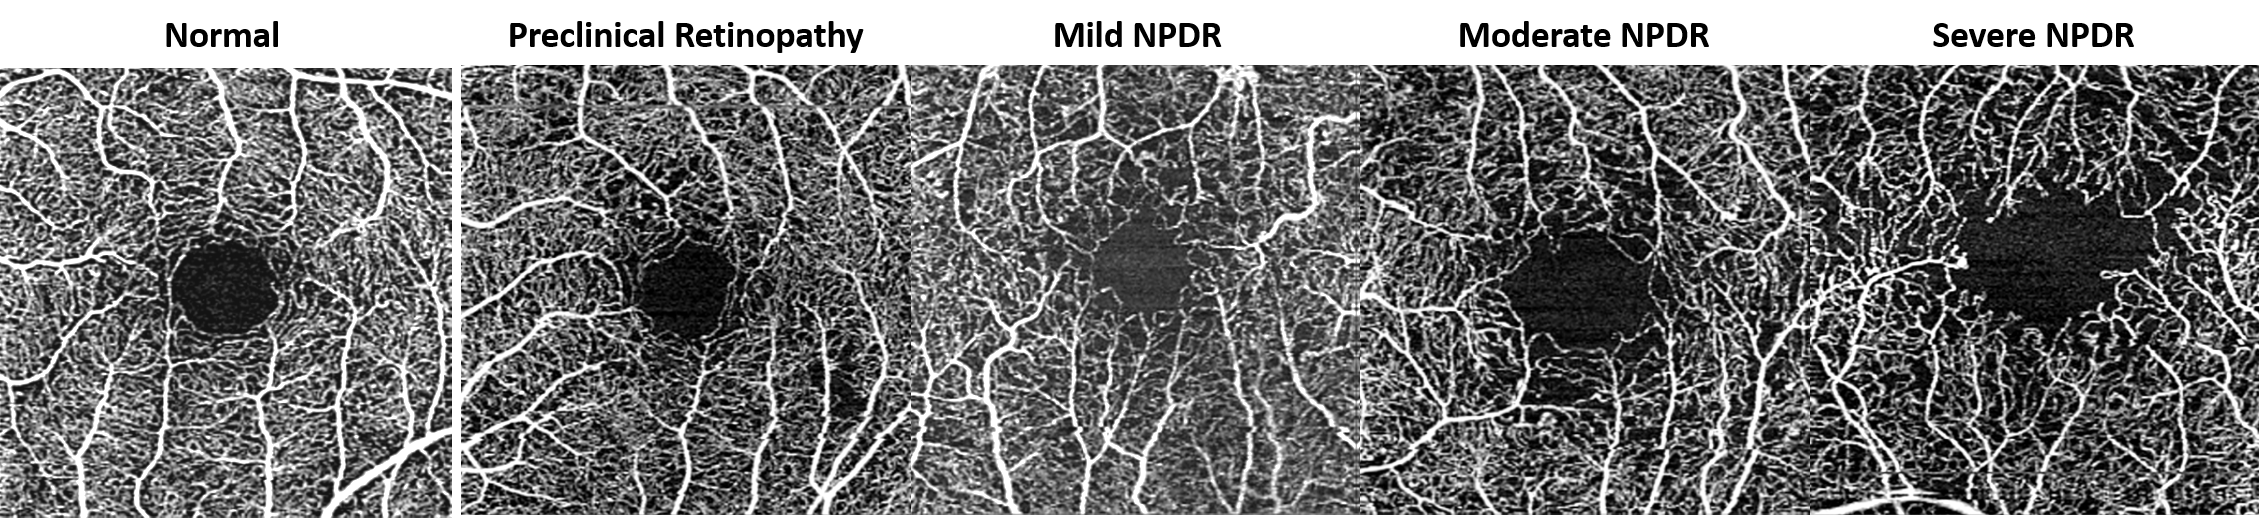
Figure 6: FAZ degeneration and nonperfusion noted in various stages of diabetic retinopathy. A normal OCT-A scan is provided for reference.
Progressive retinal ischemia can lead to vasoproliferation on the retinal surface, optic nerve head, or anterior uvea via the release of angiogenic factors such as VEGF and platelet-derived growth factor. These highly permeable new vessels often grow on the border of perfused and non-perfused retina where they tend to hemorrhage or leak. It is important to identify these new vessels early and refer for treatment to prevent vision threatening disease. Neovascularization of the retinal surface can be easily differentiated from hemorrhages or intraretinal vasculature by the OCT-A slab in which it is detected. The VRI layer, which is normally black and void of signal, will have a hyperreflective lacy lesion corresponding to any neovascularization on the retinal surface. This same technique can be used for the assessment of neovascularization of the optic nerve head.

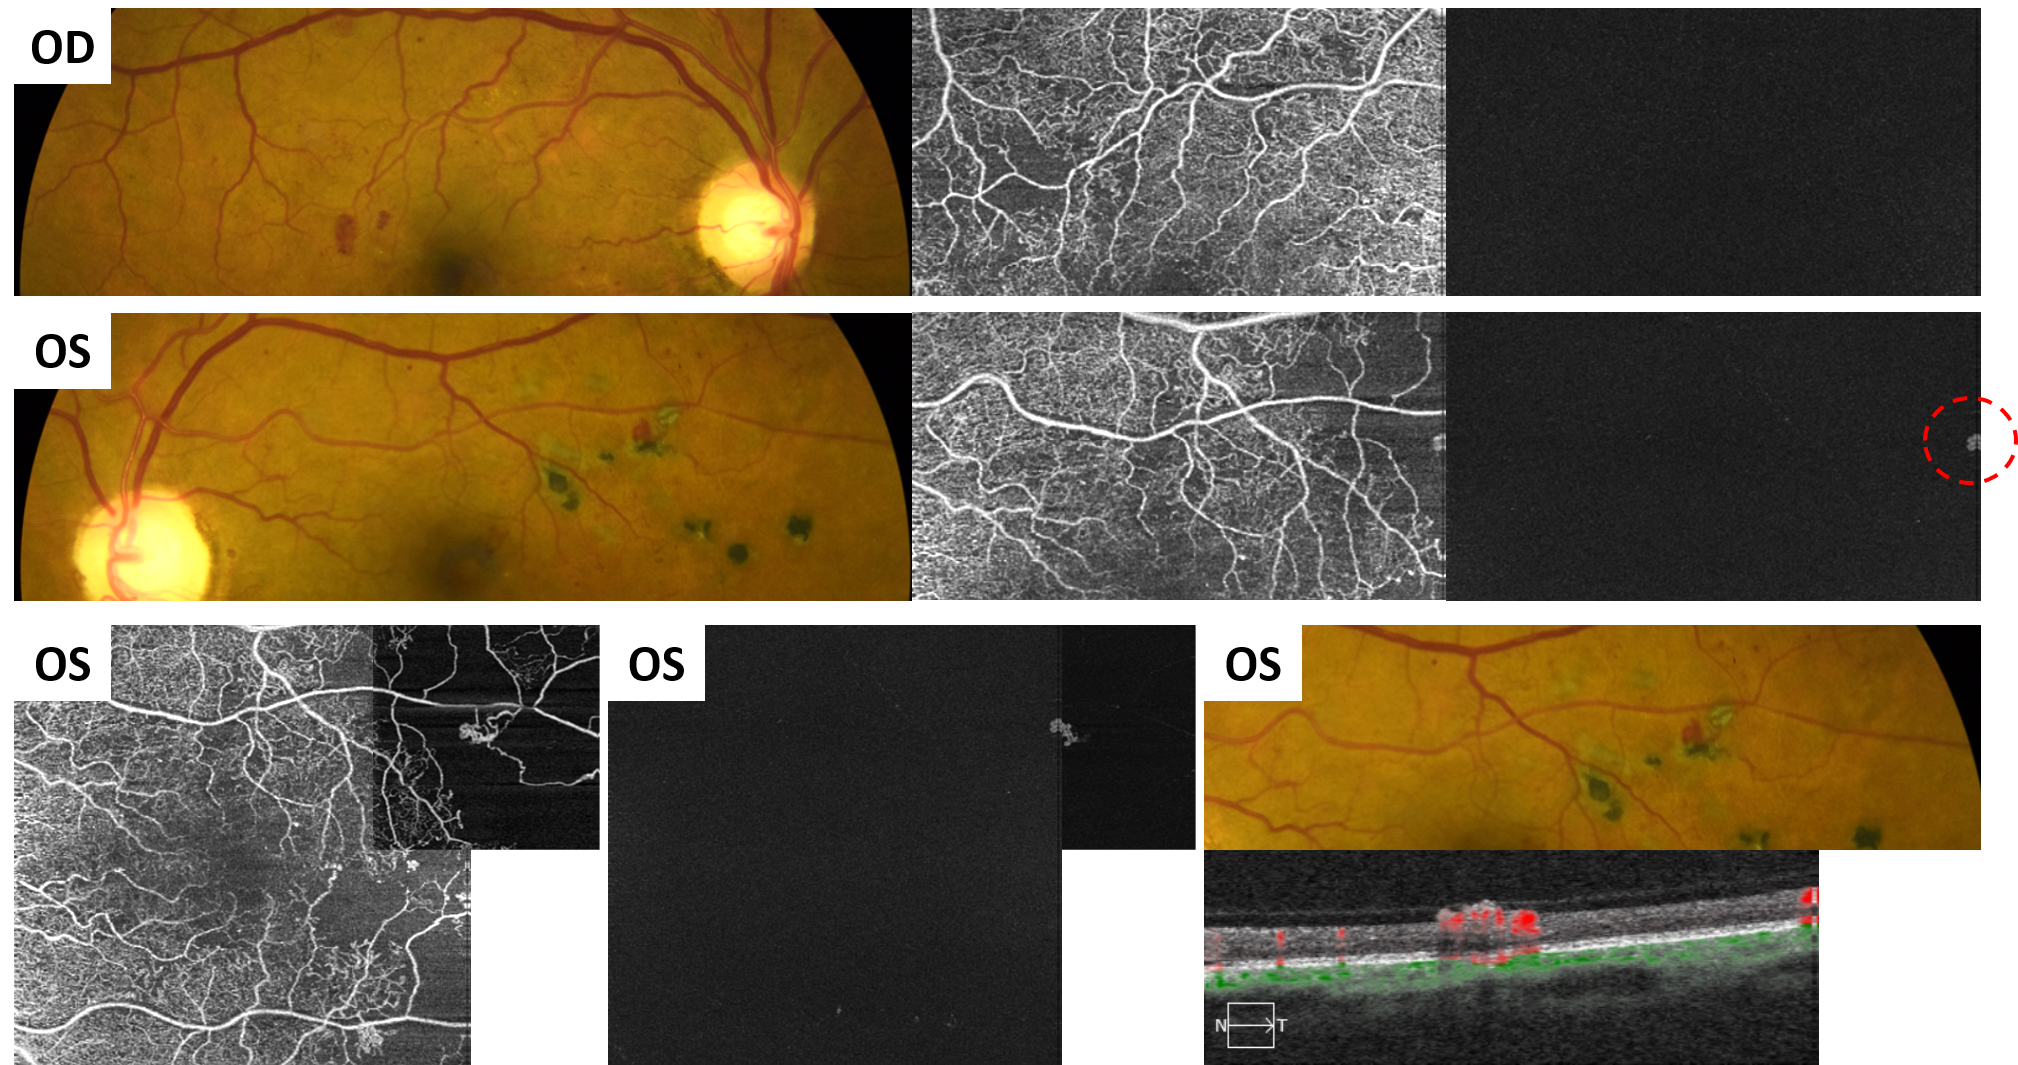
Figure 7: OCT-A images of active proliferative diabetic retinopathy. Note the “blot heme” in the right eye and the “blot heme” in the left eye that seem identical on clinical exam. OCT-A reveals the “blot heme” in the left eye is actually a small neovascular tuft.
Patients with quiescent proliferative diabetic retinopathy (PDR) will often present with significantly reduced visual acuity but will have no active retinopathy. Frequently, the visual acuity deficit will be out of proportion to the amount of macular atrophy. Structural OCT imaging will usually reveal diffuse macular atrophy without edema or exudation. OCT-A imaging is incredibly useful in these patients because it will reveal significant macular ischemia and irregularity of the FAZ. Unfortunately, there is no treatment for macular ischemia, but the identification of macular ischemia is helpful in patient education and for prognostic purposes.

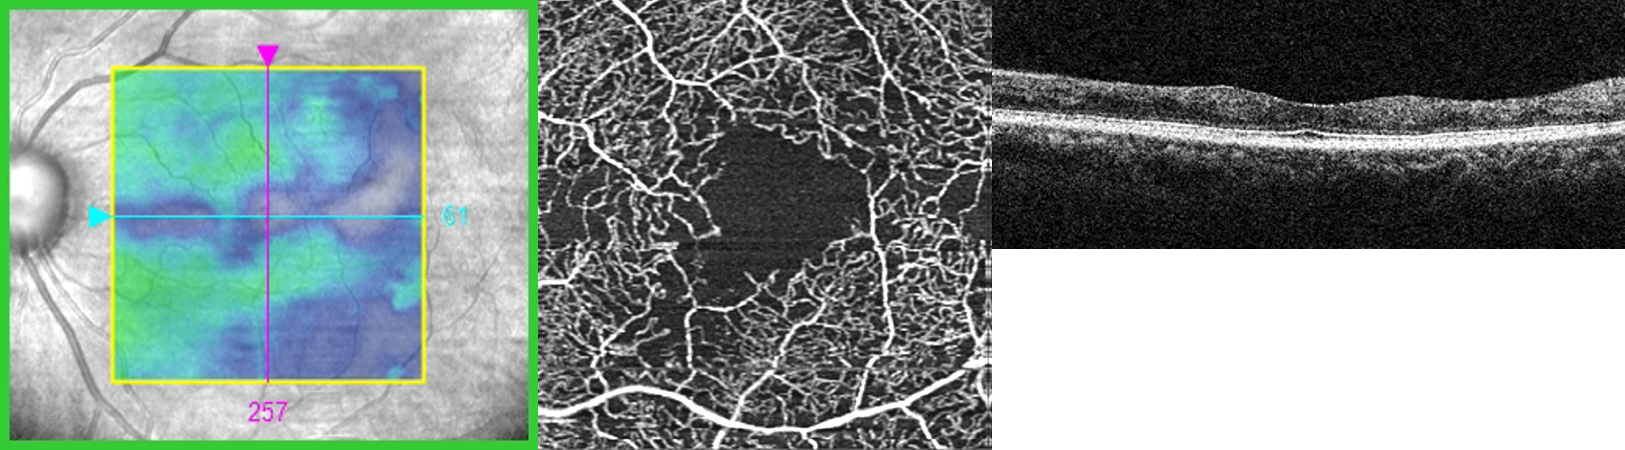
Figure 8: In patients with quiescent proliferative diabetic retinopathy, OCT-A imaging will reveal significant macular ischemia and irregularity of the FAZ. This patient has 20/40 vision even though there is no hemorrhage or macular edema.
How can OCT-A help classify retinal vein occlusion?
Retinal vein occlusions (RVOs) occur when a retinal vein becomes occluded via thrombus, vasculitis, or another mechanism. The vein occlusion is classified as branch, hemi, or central depending on the location of the obstruction. Hemorrhages, cotton wool spots, and vascular remodeling will correspond to the area affected by the occlusion. Vein occlusions may resemble diabetic retinopathy, especially in low-grade or resolving cases. Significant interocular or intraocular (in the case of a branch- or hemi-retinal vein occlusion) asymmetry can help differentiate NPDR from retinal venous occlusive disease. Both diabetic retinopathy and retinal vein occlusions can present with macular edema which can be difficult to distinguish without significant asymmetries or association with a single vein.

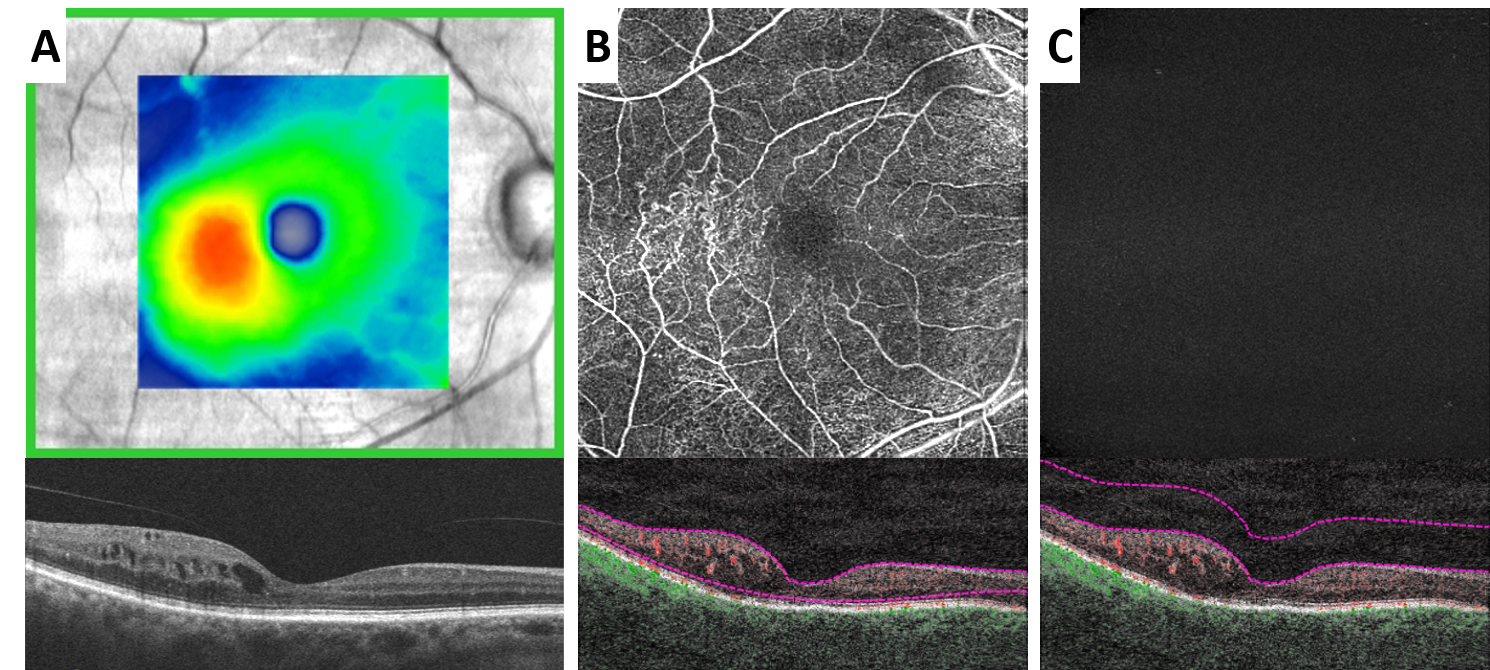
Figure 9: In cases of retinal vein occlusive disease, OCT-A can map out the extent of retinal nonperfusion which is correlated with risk of neovascularization development. Note the areas of vascular remodeling (B) temporal to the fovea correlating to the area of macular edema (A). The vitreoretinal interface slab (C) does not show any signs of neovascularization.
RVOs with significant retinal ischemia can develop neovascularization which needs to be promptly treated to prevent vision loss. OCT-A can map out the extent of retinal nonperfusion which is correlated with risk of neovascularization development. As with diabetic retinopathy, analysis of the VRI slab can easily identify neovascularization which may hasten the need for an evaluation with a retinal specialist.
What OCT-A can reveal about age-related macular degeneration
Age-related macular degeneration (AMD) is characterized by drusen, retinal pigment epithelium (RPE) abnormalities, and choroidal neovascularization (CNV). Based on the particular subtype and stage of disease, management plans can greatly vary from yearly monitoring to monthly intravitreal anti-VEGF injection. For this reason, it is important to properly categorize the subtypes of AMD and recognize early signs of CNV to prevent vision loss.
Drusen are lipid-rich deposits between the RPE and Bruch’s membrane, which can vary greatly in shape and size. Large, soft drusen can cause significant RPE elevations mimicking fibrovascular pigment epithelial detachments (PEDs). It is important to distinguish drusenoid PEDs from those caused by choroidal neovascularization to ensure early detection of treatable disease. Fibrovascular PEDs tend to be more irregular than drusenoid PEDs but can also be differentiated based on the presence of vascular flow on OCT-A. A drusenoid PED will never have any flow signal within the lesion whereas an active CNV PED will reveal a flow signal in the avascular, choriocapillaris, and/or choroid OCT-A slabs.

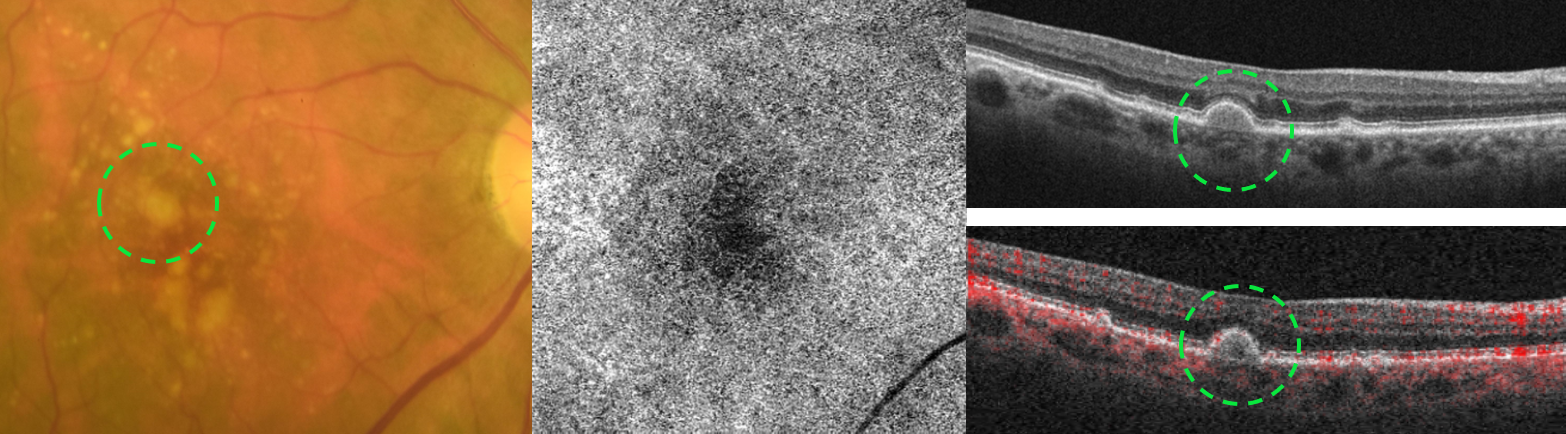
Figure 10: OCT-A can be used to ensure that drusenoid pigment epithelial detachments do not harbor any neovascularization.
With the advent of OCT-A, a new subtype of neovascular AMD was delineated: nonexudative CNV. This entity describes CNV that is quiescent and does not leak on FA.5 Though there is active blood flow, there is no leakage on FA because no dye is escaping the blood vessels. The FA findings are often so subtle that only OCT-A and ICGA can detect these lesions. With structural OCT, nonexudative CNV most often present as shallow irregular PEDs without associated serous fluid. The avascular, choriocapillaris, and/or choroid OCT-A slabs will demonstrate active flow which must be monitored for signs of exudative conversion. In studies of patients with neovascular AMD in one eye and intermediate AMD in the fellow eye, 5.5%-27.0% of intermediate AMD eyes harbored nonexudative CNV.5,6 Up to 80% of nonexudative CNV will convert to exudative disease within two years, therefore the detection of nonexudative CNV is paramount in the quest for early detection of treatable disease.6

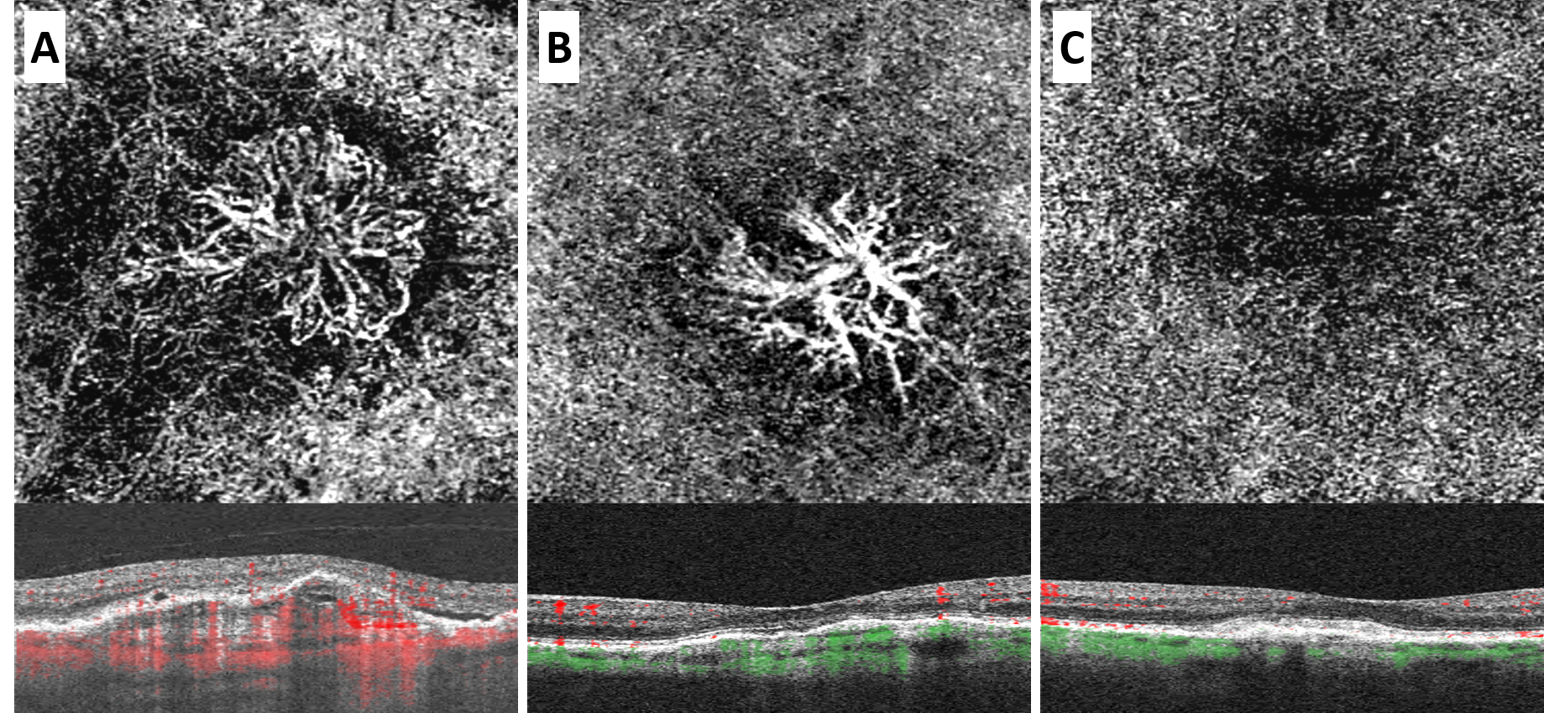
Figure 11: Active CNV (A), nonexudative CNV (B), and a disciform scar (C). Pigment epithelial detachments are visualized with structural OCT in all three cases, but OCT-A reveals a choroidal neovascularization in A and B only. Note the similarity of the shallow pigment epithelial detachment in B and C.
Characterize central serous chorioretinopathy/pachychoroid spectrum disorders
Central serous chorioretinopathy (CSC) is a relatively common and often self-limiting chorioretinopathy characterized by fluid accumulation underneath the retina and/or RPE. CSC, along with pachychoroid neovasculopathy and pachychoroid pigment epitheliopathy, belongs to a group of conditions dubbed pachychoroid spectrum disorders. These conditions are all characterized by a permanently thickened and hyperpermeable choroid which can be visualized by OCT and ICGA, respectively.
CSC is readily identifiable by funduscopy or OCT imaging as a serous retinal detachment with or without the presence of a PED. These lesions are often self-limiting and can be monitored without treatment. To determine if a case of CSC can be monitored without treatment, it is essential to rule out the presence of CNV. CSC with comorbid CNV can have devastating effects on vision and must be treated appropriately. A serous PED will be completely hyporeflective with structural OCT imaging without any blood flow on OCT-A. In contrast, a fibrovascular PED will be more hyperreflective than the serous PED with a corresponding flow signal on avascular, choriocapillaris, and/or choroid OCT-A slabs.

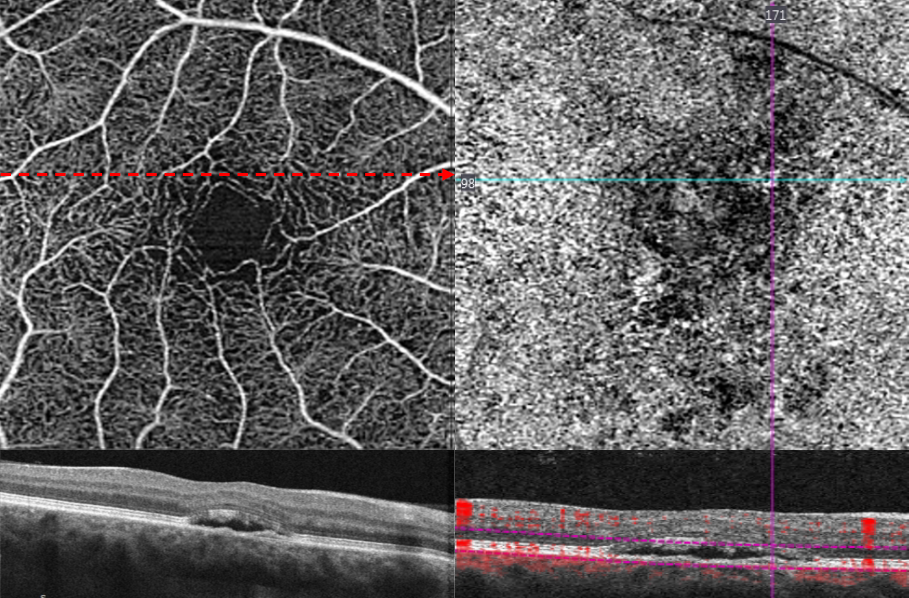
Figure 12: OCT-A images can determine if choroidal neovascularization (CNV) is present in a case of central serous chorioretinopathy (CSC).
Use OCT-A to identify sickle cell retinopathy
Sickle cell disease is an inherited hemoglobinopathy that leads to irregularly shaped erythrocytes and a chronic hemolytic state. Sickle cell retinopathy is most commonly known to cause peripheral vaso-occlusive disease resulting in peripheral hemorrhages, salmon patches, black sunbursts, peripheral fibro vascularization, and ultimately, vitreous hemorrhage and tractional retinal detachment. Less well known are the posterior pole manifestations of sickle cell retinopathy such as FAZ enlargement, perifoveal capillary drop out, microaneurysm formation, and macular atrophy; collectively known as sickle cell maculopathy. These changes are often invisible to ophthalmoscopy and asymptomatic. It is important to assess for sickle cell maculopathy, as it may mimic other retinal and optic nerve diseases.

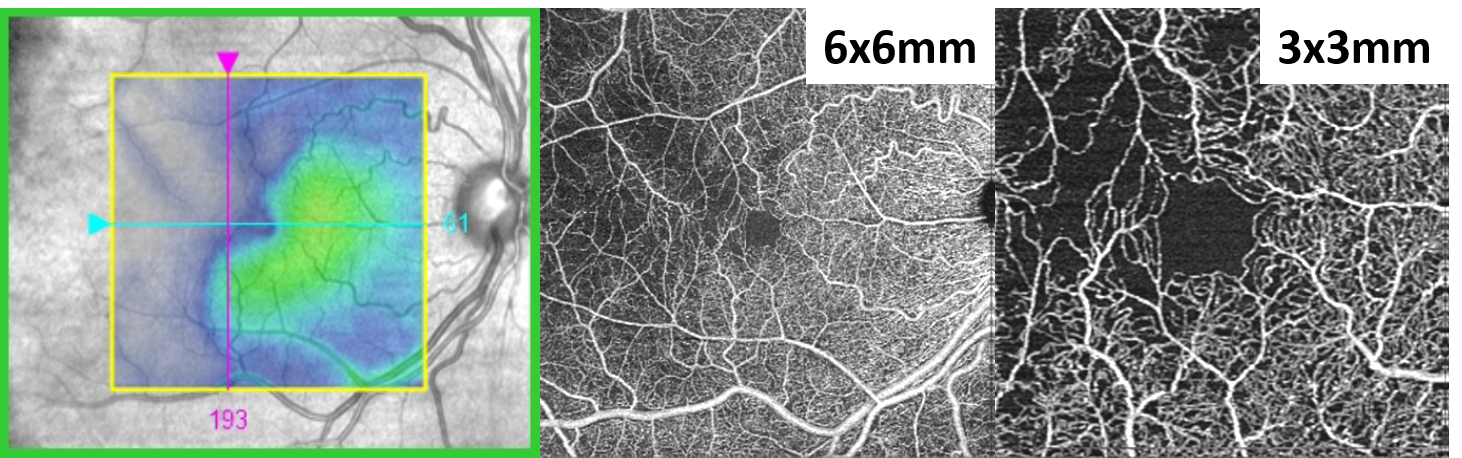
Figure 13: Sickle cell maculopathy is often invisible to ophthalmoscopy and asymptomatic, but easily detected with OCT-A. It is important to rule out sickle cell maculopathy as it can mimic other conditions such as glaucoma, branch retinal artery occlusion, and diabetic macular ischemia.
Leverage OCT-A technology to advance collaborative care
With the changing healthcare landscape, collaborative care between the optometrist and ophthalmologist has become a boon for both professions. With overlapping but complementary skill sets, optometrists and ophthalmologists share patient care to provide better management than each doctor can alone. Essential to this co-management approach, is a common diagnostic approach. The OD acts as the gatekeeper, accurately identifying disease and referring for further intervention to the ophthalmologist when necessary. The ophthalmologist provides the additional treatment and then is able to discharge the patient back to the optometrist or share follow-up with alternating visits between the optometrist and ophthalmologist. In retinal vascular disease, OCT-A facilitates collaborative care by improving diagnostic accuracy and preventing superfluous referrals. This keeps patients in the optometrist’s office and prevents non-interventional disease from clogging up the ophthalmologist's office. OCTA is a quickly evolving technology that is changing how clinicians evaluate ocular blood vessels. ZEISS AngioPlex OCT Angiography adds to the capabilities of the ZEISS CIRRUS OCT with noninvasive, reproducible, and quick imaging of retinal and choroidal blood vessels. This new technology can be easily implemented into any optometric practice thanks to features such as FastTrac and FORUM integration; ensuring that the CIRRUS OCT will continue to be the workhorse of any optometric practice while providing the very latest in clinical analysis.
References
- Cao, Dan, et al. "Optical coherence tomography angiography discerns preclinical diabetic retinopathy in eyes of patients with type 2 diabetes without clinical diabetic retinopathy." Acta diabetologica 55.5 (2018): 469-477.
- Sun, Zihan, et al. "Optical coherence tomography angiography in diabetic retinopathy: an updated review." Eye 35.1 (2021): 149-161.
- Thompson, Ian A., Alia K. Durrani, and Shriji Patel. "Optical coherence tomography angiography characteristics in diabetic patients without clinical diabetic retinopathy." Eye 33.4 (2019): 648-652.
- Nunes, Sandrina, et al. "Microaneurysm turnover is a biomarker for diabetic retinopathy progression to clinically significant macular edema: findings for type 2 diabetics with nonproliferative retinopathy." Ophthalmologica 223.5 (2009): 292-297.
- Laiginhas, Rita, et al. "Nonexudative macular neovascularization–a systematic review of prevalence, natural history, and recent insights from OCT angiography." Ophthalmology Retina 4.7 (2020): 651-661.
- Or, Chris, et al. "Vascularized drusen: a cross-sectional study." International journal of retina and vitreous 5.1 (2019): 1-6.
**All images courtesy of Daniel Epshtein, OD, FAAO
en-INT_31_200_0228I

