


Case #1: From Glaucoma Suspect to Fast Progressor
Presented by Daniel Epshtein, OD, FAAO
Case history
The patient was first examined in 2006 by another eyecare provider (ECP) after being referred by an infectious disease specialist to undergo an HIV ocular exam. This was his first ocular exam and he had no ocular complaints. Exam findings revealed intraocular pressures (IOPs) that were slightly borderline at 20 mmHg in the right eye and 21 mmHg in the left. His pachymetry readings indicated thin corneas, more so in the left eye than the right eye. Gonioscopy was open with a ciliary body (CB) visible in both eyes. Both the anterior and posterior segments were unremarkable, except for the cupping of his optic nerve, which revealed a cup-to-disc ratio (CDR) of 0.6 in the right eye and 0.7 in the left eye.
First ocular exam: 2006
- 48 year-old male referred by infectious disease specialist for HIV ocular exam
- Medical history: HIV, HTN, asthma
- No ocular complaints
- IOP: 20 mmHg OD/21 mmHg OS
- Pachymetry: 521 μm OD/503 μm OS
- Gonioscopy: Open to CB 360 OD/OS
- Anterior segment unremarkable
- CDR: 0.60 OD/0.70 OS
- Posterior segment otherwise unremarkable
The patient was diagnosed as a glaucoma suspect and visual field (VF) testing was ordered. Findings revealed a small lid defect in the right eye and some nonspecific defects in the left eye, but no significant glaucomatous defects.

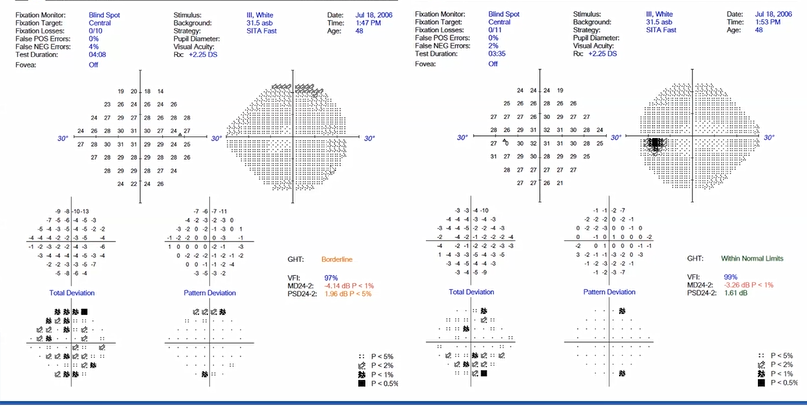
The ECP recommended a follow-up evaluation in one year.
Although the patient didn’t consistently comply with recommendations for annual evaluations, he was monitored intermittently for many years. I first evaluated him in 2017, by which time he had been diagnosed with glaucoma. The following case update is from a recent visit in 2022.
Case presentation: 2022 visit
At this point, the patient is a 65 year-old-male presenting for a doctor-directed glaucoma follow-up visit. I had previously diagnosed him with mild POAG (primary open-angle glaucoma) in the right eye and advanced POAG in the left eye. Unfortunately, he did not keep his follow-up visits multiple times, even after he was diagnosed with glaucoma. Due to his progression and lack of adherence, he was referred to a glaucoma specialist multiple times, but never made it to that visit.
- 65 y/o male presents for doctor-directed glaucoma follow up
- Medical history: HIV, HTN, COPD
- OD mild POAG; OS advanced POAG
- Lost to follow-up multiple times
- Referred to glaucoma specialist multiple times but never kept the appointment
Equipment used for exam:
- Tonometer
- Gonio lens
- Fundus camera
- Perimeter
- Optical coherence tomography machine (OCT)
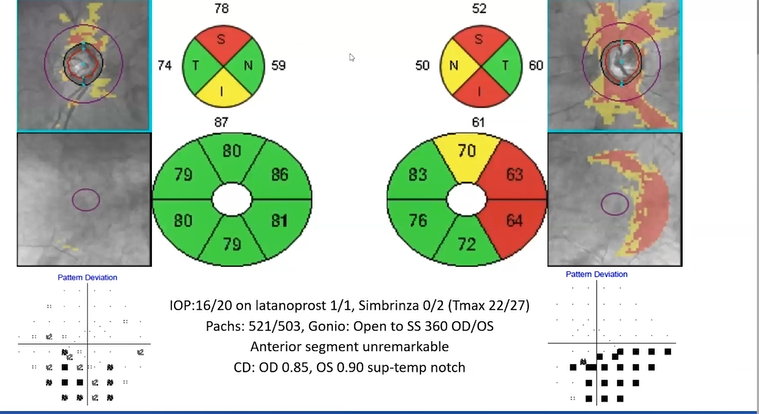
On this visit, his IOP is 16 mmHg in the right eye and 20 mmHg in the left. He is on latanoprost once a day in both eyes and a brinzolamide-brimonidine combination twice a day in just the left eye. His highest measured IOP (Tmax) was 22 mmHg in the right eye and 27 mmHg in the left eye. By this time, his cupping has increased. His CDR is 0.85 in the right eye and 0.9 in the left eye with a superior-temporal notch.
- IOP: 16 mmHg OD/20 mmHg OS on latanoprost 1/1 and brinzolamide-brimonidine 0/2 (Tmax 22/27)
- Pachymetry: 521 μm OD/503 μm OS
- Gonioscopy: Opening distance to scleral spur (SS) 360 OD/OS
- Anterior segment unremarkable
- CDR: OD 0.85, OS 0.90 with a superior-temporal notch
- Posterior segment otherwise unremarkable
OCT testing
OCT testing was also performed.
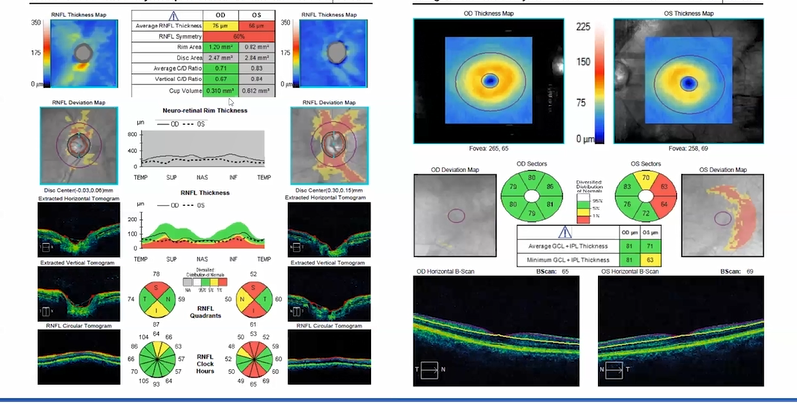
Optic nerve head (ONH) and retinal nerve fiber layer (RNFL)OU analysis reveals:
- OD: Thinning, predominantly superior to the RNFL layer
- OS: Fairly significant thinning both superiorly and inferiorly
- Quadrant quantitative analysis: Thinning is worse superiorly in the same area as the superior-temporal notch noted previously in CDR results
Ganglion cell OU analysis reveals:
- OD: Minimal issues
- OS: Thinning on the temporal portion greater superiorly than inferiorly — which correlates to ONH and RNFL OCT findings
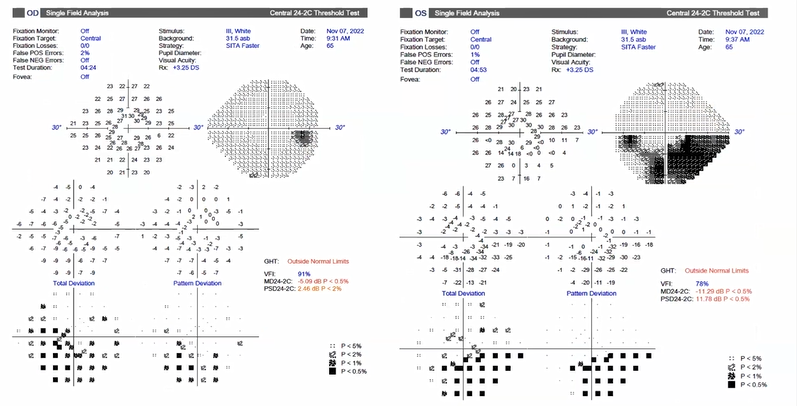
Visual field testing
Unfortunately, the patient’s VF testing indicates significant defects inferiorly in the right eye and a dense arcuate defect inferiorly in the left eye.
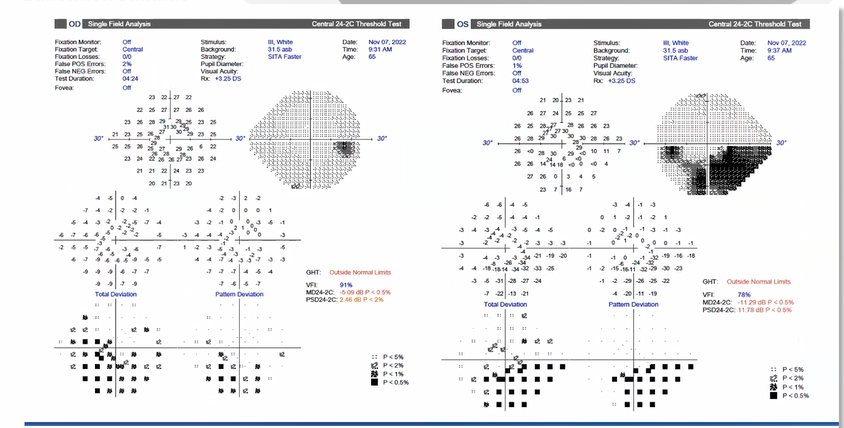
The actual decibels of sensitivity for the left eye reveals a patch of zeros in the paracentral region indicating significant vision loss fairly close to fixation, which is not good news.
Overall evaluation
When all findings are evaluated, it is apparent that the patient has glaucoma and that it is worse in the left eye than the right eye.
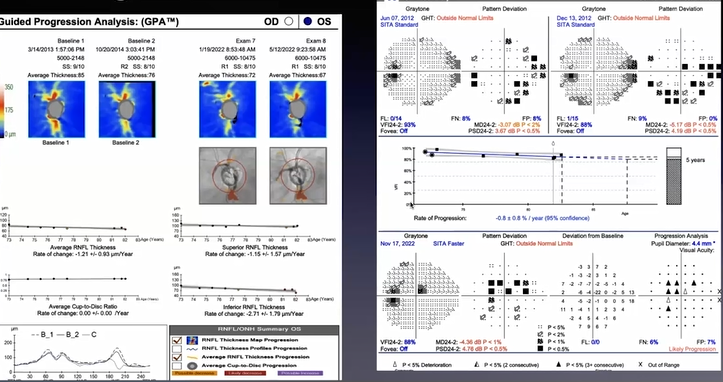
Guided Progression Analysis: OCT
The patient’s progression data can be used to further confirm the diagnosis by using progression analytics created by ZEISS. Using the patient's first two ONH scans obtained with OCT, the Guided Progression Analysis (GPA™) creates a baseline to enable comparison with all subsequent scans.
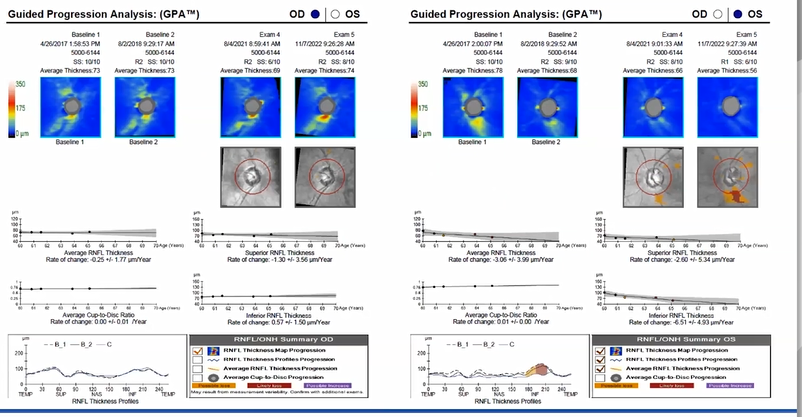
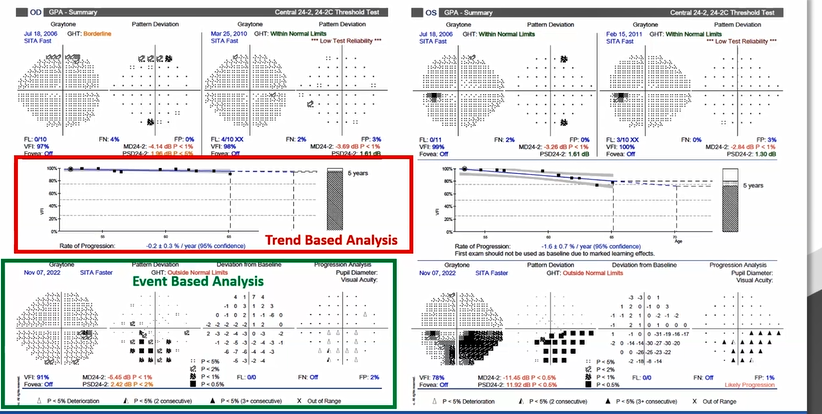
The comparison can be performed in several ways:
- Event-based analysis: Looks for statistically significant changes when comparing scans. Possible loss will show up as orange and likely loss will show up as red. Note that from 2017 to 2022, this patient’s analysis indicates little progression because much of his disease occurred prior to OCT imaging using this particular instrument.
- Trend-based analysis: Measures the rate of change of the RNFL thickness, which can be performed for an average RNFL, the superior RNFL, or the inferior RNFL. This patient's rate of change superiorly is -1.3 μm/year.
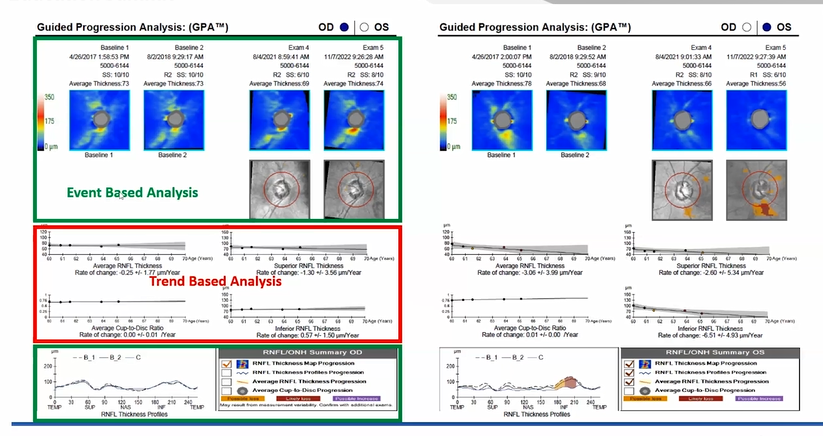
The GPA clearly demonstrates more significant disease in the left eye with significant progression on both the event-based analysis and the trend-based analysis:
- In 2021, the patient shows possible loss.
- The following year, that possible loss has transformed into likely loss and there is a larger area of possible loss.
- Although his trend-based analysis indicates a -3 μm/year loss on average RNFL, his inferior RNFL reflects a -6 μm/year loss — indicating rapid progression.
Guided Progression Analysis: Ganglion cell
Ganglion cell measurements are very important, and ZEISS has created a Guided Progression Analysis for these, as well.
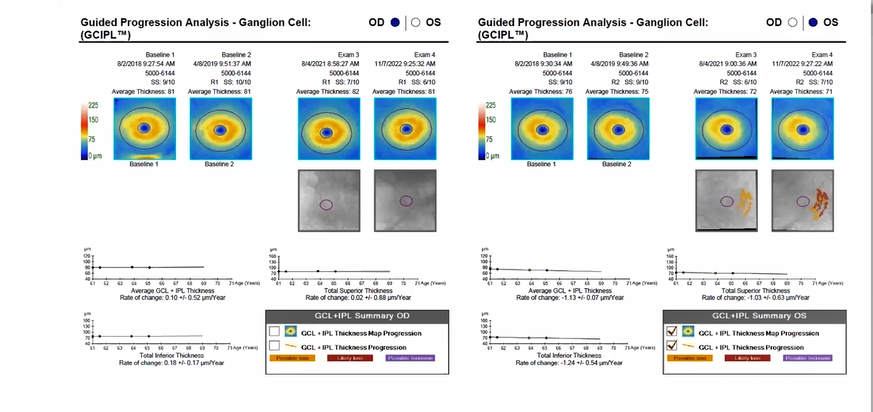
Again, both event-based and trend-based analyses are available.
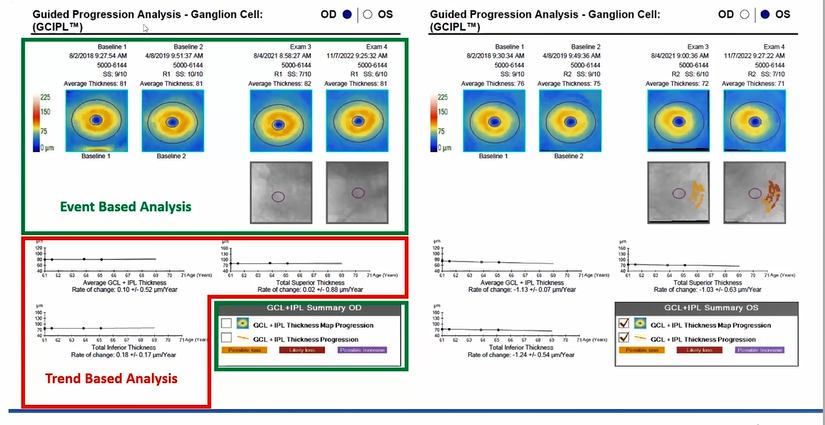
Results indicate:
- OD: Minimal changes
- OS: Possible loss in 2021; likely loss in 2022; rate of change on the trend-based analysis of approximately -1.1 μm/year
Guided Progression Analysis: Visual field
Since assessing vision loss in glaucoma patients is the priority, the most important indicator for disease progression is the VF. In this patient, the GPA for the VF is very similar to that found on the OCT.
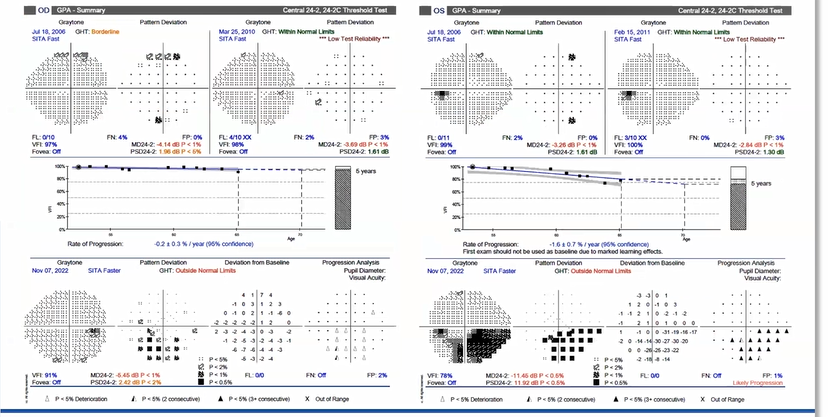
Similar to the OCT GPA, the results of the first two VF tests are used to create a baseline for comparison to subsequent VF tests, and both trend-based and event-based analyses are provided:
- Trend-based analysis: Assesses the rate of change of the visual field index (VFI), which is similar to a summary statistic of the entire VF.
- Event-based analysis: Provides a type of point-to-point comparison in which each point is compared to the baseline. The colors of the triangles represent how many VFs exceed baseline variability:
- White: One VF
- Half black and half white: Two VFs
- All black: Three or more VFs
Since this patient’s left eye has more significant disease, the slope on the GPA VF is more negative and there are many black triangles, indicating significant progression on at least three visual fields.
In a trend-based analysis of VFI progression:
- -0.5%/year is considered a slow rate of progression.
- -1.0%/year is considered a fast rate of progression.
In a trend-based analysis of mean deviation (MD):
- -0.5 dB/year is considered a slow rate of progression.
- -1 dB/year is considered a fast rate of progression.
Guided Progression Analysis: RNFL
A trend-based analysis can also be helpful when looking at the retinal nerve fiber layer (RNFL). However, it is important to remember that in terms of the RNFL thickness, approximately 0.5 μm/year is considered age-related loss, but a 2 μm/year loss is considered to be a pathological change.
Guided Progression Analysis: Ganglion cell
The same type of assessment can be performed for ganglion cell measurements.
However, in this instance, approximately 0.32μm/year is considered age-related loss, and approximately 2μm/year is considered pathological loss.
Case #2: Detecting and Managing Progression in Glaucoma: The Changeup
Presented by Jennifer Turano, OD, FAAO
Case history
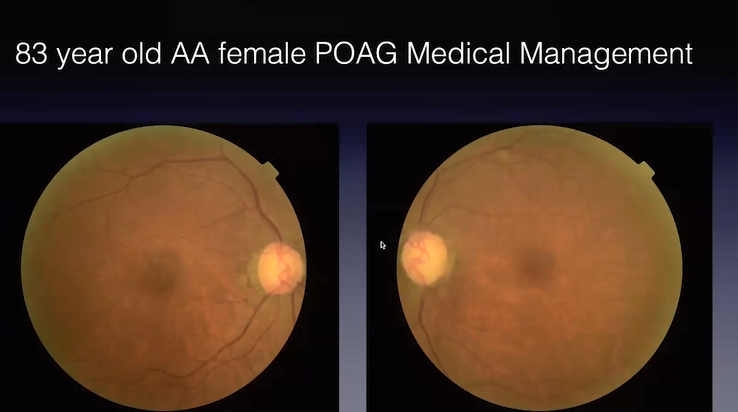
The patient is an 83-year-old African-American female with primary open-angle glaucoma (POAG) who has been medically managed in the clinic for 11 years. She has been receiving medical treatment only consisting of three different drops. She is also on seven systemic medications. In light of her age and the volume of medications prescribed, compliance is a concern. Additionally, since her medications have been maximized, we've had multiple conversations regarding additional interventions — including laser treatments and surgery — but this patient is very resistant to these options.
- 83-year-old AA female with POAG
- Medically managed for 11 years
- Most recent IOP: 10 mmHg OD/8 mmHg OS
- Tmax: 26 mmHg
- Medication compliance a concern
- Resistant to additional interventions
Medications:
- Latanoprostene bunod 0.024% Qpm OU
- Dorzolamide BID OU
- Brimonidine BID OU
- Empagliflozin
- Losartan
- Amlodipine
- Glipizide
- HCTZ
- B12
- Pravastatin
Equipment used for exam:
- Tonometer
- Fundus camera
- Perimeter
- Optical coherence tomography machine (OCT)
Fundus photos
Fundus photos demonstrate marked asymmetry between the left and right eyes with a nearly complete obliteration of the neuroretinal rim between three and six o'clock on the left eye with a corresponding wedge defect in the retinal nerve fiber layer (RNFL).
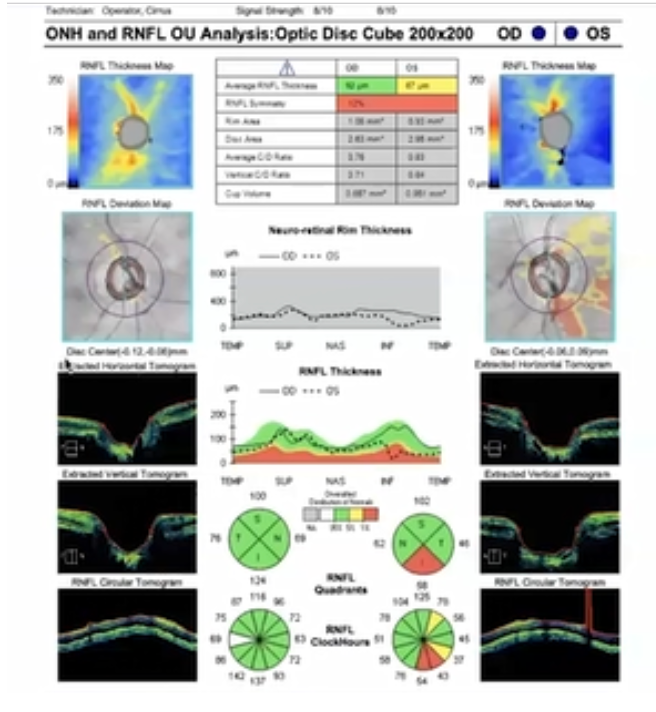
OCT testing
OCT results indicate thinning of the RNFL and neuroretinal rim in the left eye when compared to the right eye. Normative data on the neuroretinal rim thickness is unavailable, since the patient has a large flail opening. However, the discrepancy between the two is apparent.

Visual field testing
Visual field (VF) testing indicates a fairly marked change in the right eye, as well as some central defects in the left eye.
I like to utilize visual fields to help patients better understand the impact of disease progression, especially for those who are resistant to additional treatment. However, this patient reports no negative impact on her activities of daily living, despite the central defects in her left eye. As a result, she doesn’t feel there are any problems with her vision and sees no need for surgery — the thought of which causes her a lot of anxiety.
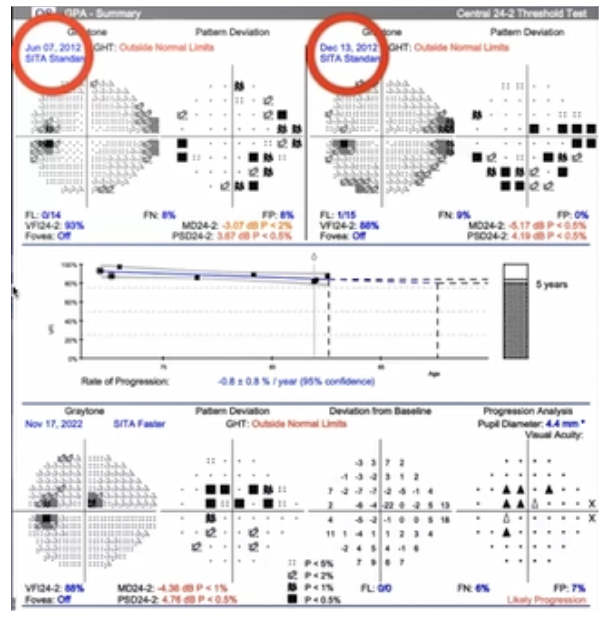
Guided Progression Analysis: OCT
Guided Progression Analysis (GPA) of the patient’s OCT results also confirm progression, especially in the inferior area where the rate of change in the RNFL is -2.71 μm/year. This amount of change is significant and well above the expected age-related rate of change. There is also a significant level of change in the mean deviation (MD).
Assessing the complete picture with GPA
Although this is a clear-cut case of a patient with glaucoma who is experiencing progression, the purpose in discussing it is to demonstrate how GPA and related tools can be utilized to better assess the complete clinical picture.
These baselines were taken in 2012 when the patient first presented to the clinic.

A lot has changed since then:
- 2013: Initiated treatment with latanoprost 0.005%
- 2016: Added brimonidine due to insufficient IOP
- 2017: Added dorzolamide due to insufficient IOP
- 2019: Poor compliance. Offered phacoemulsification, selective laser trabeculoplasty (SLT), trabeculectomy
- 2020-2021: Lost to follow-up; Pt discontinued dorzolamide; IOP 28 mmHg
- 6/2021: New afferent pupillary defect (APD) OS; restarted dorzolamide
- 4/2022: IOP 22 mmHg on latanoprost 0.005%; changed to latanoprostene bunod 0.024%
The change-up
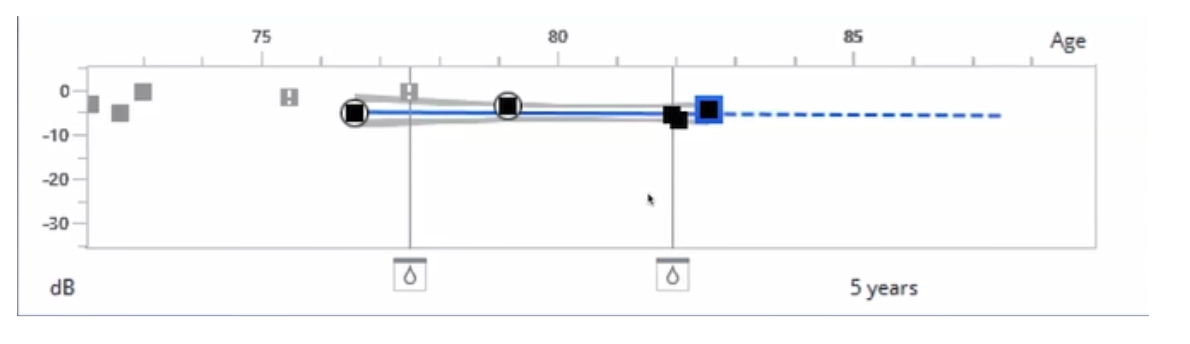
In light of all the changes that have occurred over the past ten years, there is value in adjusting the baseline for the most recent intervention. Doing so makes it possible to more accurately assess the patient’s rate of progression to help guide the treatment approach.
In this patient’s case, the last changeup occurred when the patient was lost to follow up between 2020 and 2021. During that period, she had a medication change due to insufficient IOP.
In the image below of a progression indicator line, the two drop icons make it possible to move the baseline according to the last changeup. These represent the latest changes in her medication, which were changes in drops. The left is the baseline that was moved. I chose this baseline since it represents the period when the patient returned to our clinic after she was lost to follow up. She did have an alteration to her prostaglandin since then, but GPA needs at least five visual fields to run progression, and I don’t have enough data to support that yet.

The following demonstrates how that change makes a difference in the patient’s GPA calculation.
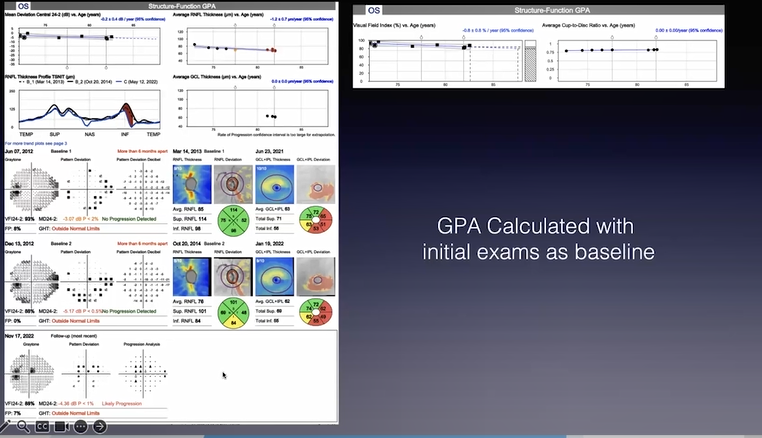
- GPA calculated based on initial visit in 2012: There is a big change in the inferior-temporal RNFL as expected, as well as likely progression according to the GPA indicator for progression.
- GPA calculated based on adjusted baseline: The RNFL loss is visible in the inferior area, but the progression indices and slopes are more flatlined, indicating that the comparative rate of change is less significant.
In this context, it’s important to understand what’s being assessed in terms of progression. If the complete picture is assessed, use of the 2012 baseline prior to treatment leads to a rate of change of 0.8% in a year, which is a severe rate of progression. However, if the baseline is adjusted, that rate of change is decreased to 0.4%, indicating a much slower rate of progression since the patient is back on track with medication compliance.

Revisiting goals
When the goals for the patient are revisited, the priority in this context is to determine the rate of progression to more accurately predict the risk of visual acuity loss. In addition to the use of VF testing, GPA, and OCT to achieve these goals, it is also important to remember to initiate testing early and at any point at which there is an intervention. This approach is supported by a study demonstrating that more frequent VF testing helps to decrease the time frame needed to confidently detect rates of change that indicate disease progression.1
Concluding case summary
- 83 y/o female
- Central defects OS
- Asymptomatic
- Consistent aversion to surgical intervention
- Lost to follow up and non-compliant with medications in the past
- Since returning to clinic, pt seems to be on track with meds, has excellent IOPs, and lower likelihood of progression with GPA recalculation
Take-home points
- Remember that the rate of progression guides treatment, so test early and often.
- Don’t forget the change up. There’s value in adjusting the baseline for the most recent intervention to more accurately assess the rate of progression.
