


WHAT YOU'LL LEARN
Understand the test battery for glaucoma
Describe the structure and function relationship of glaucoma
Learn how to systematically analyze a visual field
Understand the new 24-2C Test Pattern and compare to 24-2 and 10-2
Introduction
This course will review the basic glaucoma test battery and the structure-function relationship in glaucoma. You will also learn how to systematically analyze a visual field. Finally, you will learn the latest innovations in visual field technologies and how they can be integrated into clinical care of patients with glaucoma.
Note: This course is self-directed learning, and is not COPE-approved CE.
Glaucoma Test Battery
Like with any other ocular condition, we always start our exam with a case history. We want to ask if there is a family history of glaucoma, any ocular trauma, or a history of topical corticosteroid use. Of course we need to assess IOP with Goldmann Applanation Tonometry since this is the gold standard for measuring IOP. A good baseline IOP is important since it is the only modifiable risk factor for glaucoma. We need pachymetry since thin central corneal thickness is an independent risk factor for glaucoma. We need gonioscopy in order to classify the type of glaucoma. It is critical to evaluate the optic nerve with a stereoscopic view through a dilated pupil. Next, we need good baseline disc photos. Stereo photos are preferred. The test battery continues with OCT imaging of the Optic Nerve, RNFL, and Macula. Finally, we need to assess Visual Fields. The most common test patterns are 24-2 and 10-2. Now, we have the newest test pattern: 24-2C, which we will discuss more in detail later.
Structure-Function Relationship
Glaucoma Continuum
On clinical exam, we diagnose glaucoma when there is suspicious or obvious structural damage to the optic nerve head. According to Dr. Weinreb, there is a continuum of glaucomatous progression. He proposes that glaucoma starts out in the undetectable stage with microscopic remodeling and apoptosis of the lamina cribrosa and ganglion cells. This proceeds to asymptomatic disease where there are detectable changes to the RNFL and optic nerve head or mild visual field changes. The last stage is functional impairment. In this stage there is moderate to severe visual field changes, which progresses to blindness as in end stage glaucoma.

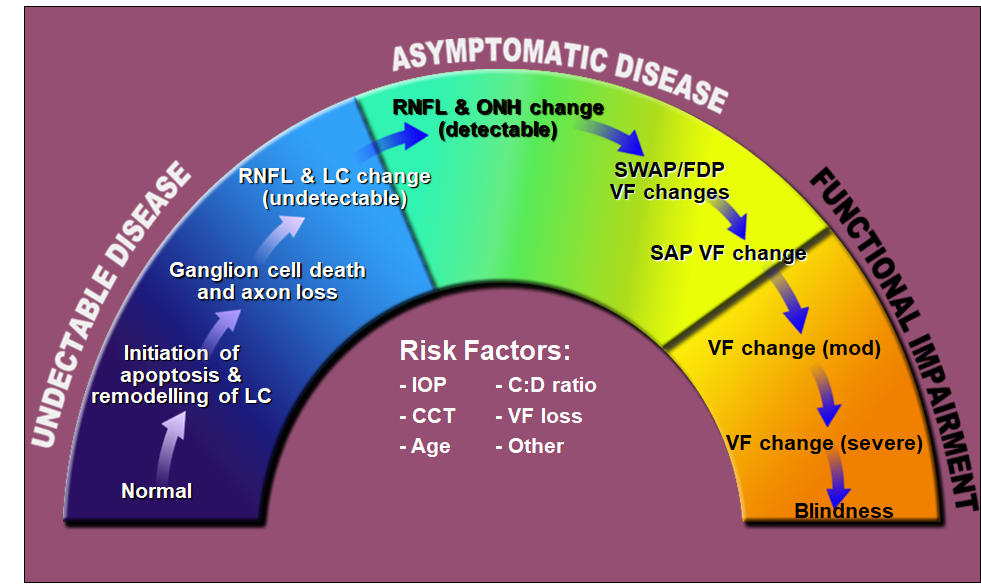
Figure 1: Glaucoma continuum. When field loss occurs, especially if it is in the better-seeing eye, the functional impairment can affect quality of life. Even mild to moderate visual field loss is associated with falls and difficulty driving.
Significant structural damage necessary before visual field loss occurs
On average, visual field loss occurs when the average RNFL has thinned to around 75 microns. This is already about a 17% loss from normal average thickness.1 This means that substantial structural loss must be necessary before functional loss occurs.

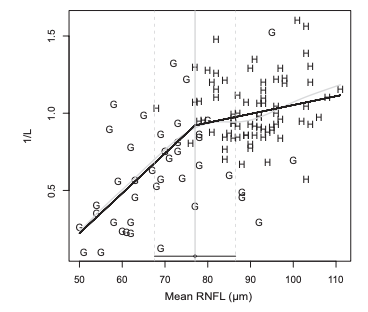
Figure 2: Scatter plot of healthy (H) and glaucoma (G) values using unlogged (1/l) visual field threshold values. The grey line is a spline fit, and the black line is the two-segment ‘broken stick’ model. RNFL—retinal nerve fiber layer, L—Lambert. (Source: Wollstein et al)
Are Visual Fields Still Relevant?
Will visual fields, a subjective functional test, continue to be performed to manage glaucoma in the future? The answer is yes. There are objective functional tests such as ERG and VEP, which may be an alternative. However, these tests are not ready to be widely accepted yet. Visual fields are still important! The testing algorithms keep getting faster. We know about SITA Standard and SITA Fast. Now there is SITA Faster, which we will discuss more later.
Why do we still perform visual fields? It helps us diagnose glaucoma. Not only that, the staging of glaucoma is still dependent on visual fields. Does the patient have mild, moderate, or severe disease? By staging the glaucoma, we can then determine target IOP and how closely we want to follow the patient. Finally, serial visual fields allow us to detect progression of glaucoma. Knowledge of progression is critical to help us decide when to intervene with changes to treatment.
Visual Field Analysis
Let us walk through step by step how to analyze a visual field. First, we verify that the right test is performed. Which strategy do we want? Do we want SITA Standard, SITA Fast, or SITA Faster? Next is stimulus size. The vast majority of fields are performed with a Test Size III. The next factor is the test pattern. Do we want a 24-2, 30-2, 10-2, or 24-2C? Is the correct eye performed? Is the correct date of birth entered so that the correct normative database is used? Furthermore, we need to make sure that the patient’s pupils are greater than 3mm in order to reduce illumination artifacts. Finally, refractive error needs to be corrected so that the data is accurate.

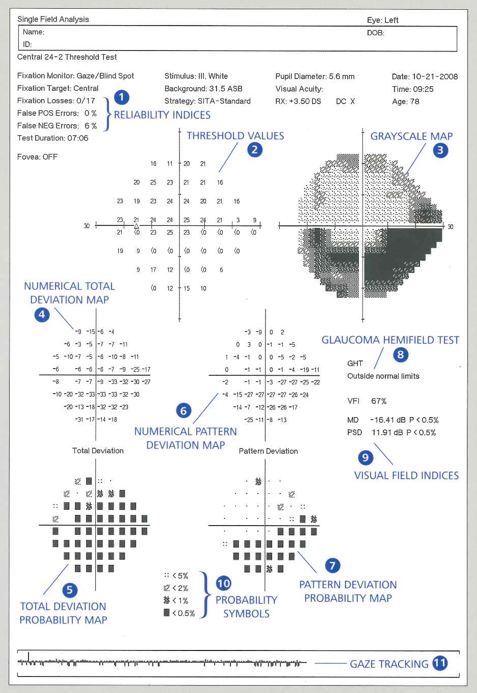
Figure 3: Humphrey Visual Field Analyzer II-i Single Field Analysis.
Next, we want to look at the reliability indices (Figure 2, 1). There are four that we generally consider. The first is fixation losses. If there are high fixation losses, this means that the patient kept moving his eye to look at a stimulus that was presented in his blind spot. The second reliability index is false positives. If there are high false positives, this means that the patient was “trigger-happy” or anxious. False negatives is the third reliability index. This means that the stimulus was seen initially, then tested again at a brighter level, but the patient did not press the button. In theory, false negatives should measure attention. However, high false negatives can also represent the variability and noise in glaucomatous disease, rather than inattention or unreliability.
The final reliability index is gaze tracking (Figure 2, 11). This is the line at the bottom of the visual field report that tracks if the patient was staring straight at the fixation light or moving his eye around during the test. If the test is unreliable, the test should not be used! Have a talk with the patient and repeat the field.
Assuming the test is fairly reliable, the next step is to review the probability plots (Figure 2, 7,8,9). There are four of these: Mean Deviation (MD), Pattern Standard Deviation (PSD), Visual Field Index (VFI), and Glaucoma Hemifield Test (GHT). MD is a number that represents the average loss for an entire field. It represents global loss of sensitivity. The higher the MD, the more global field loss a patient has. PSD is essentially a standard deviation of all the values. It represents how much all the values deviate from each other. PSD helps us look for local glaucomatous visual field defects. An increasing PSD over time is suggestive of deepening of a local defect. VFI is a single number that is based on Pattern Deviation that ranges from 0 to 100%. 100% represents a normal field, and 0% represents a blind field. GHT looks at clusters of points on either side of the horizontal meridian and gives us one of five responses: within normal limits, outside normal limits, borderline, general reduction in sensitivity, or abnormally high.
Once we review the probability plots, we can describe the pattern of loss. Is there a nasal step, arcuate defect, paracentral defect, or temporal wedge? Is fixation involved?
Finally, we want to reaffirm the diagnosis. Does the visual field defect match up with the structure of glaucomatous damage based on optic nerve exam and OCT?

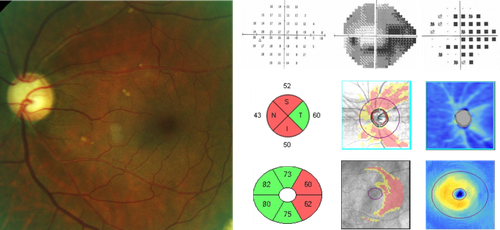
Figure 4: Glaucomatous loss revealed with visual field testing, RNFL GCA measurements.
Updates in Visual Field Testing
SITA FASTER Strategy
One of the latest innovations in visual fields is the new testing strategy SITA Faster. The SITA Faster 24-2 averages only 2 minutes or less per eye! It is 50% faster than SITA Standard and 30% Faster than SITA Fast. As far as reliability indices, it does not have blindspot monitoring so that the test can be faster. It also does not have false negatives since false negatives have been established to be the least useful reliability index. It still has false positives and gaze monitoring. There may be a slight increase in false positives due to the speed of the test.

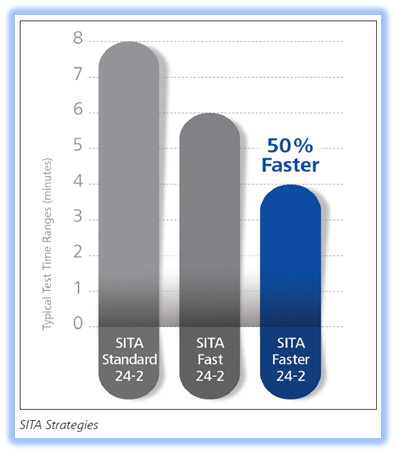
Figure 5: Average total test times for SITA Standard, SITA Fast, and SITA Faster.
How does SITA Faster compare to the tried and true SITA Standard? There was a study that compared SITA Standard, SITA Fast, and SITA Faster. What they found was that the Mean Deviation, Visual Field Index, and Glaucoma Hemifield Test were very similar among all three tests. Here are their conclusions: SITA Faster saved the most time, SITA Faster is the same as SITA Fast, and SITA Faster is only slightly different from SITA Standard.2
What if we have longtime glaucoma patients with established records using SITA Standard? Can SITA Faster be compared with old SITA Standard exams on the Guided Progression Analysis (GPA) Report? Yes! This new SITA Faster can be compared with the SITA Standard on the GPA Reports. This is called the Mixed SITA GPA.
24-2C Test Pattern
Sometimes our glaucoma patients have visual field defects that involve fixation. Here is the typical scenario for how these central visual field defects are detected. First, we obtain a baseline 24-2 on our glaucoma patients. If we see one or two of the central four points depressed, we usually obtain a 10-2 to assess the extent of the central field loss. This means the patient would have to sit through a second test that is usually performed on another day. The 10-2 actually tests 68 points, but only four of those points appear on the 24-2. It is evident that the 24-2 is not optimally designed for central points.

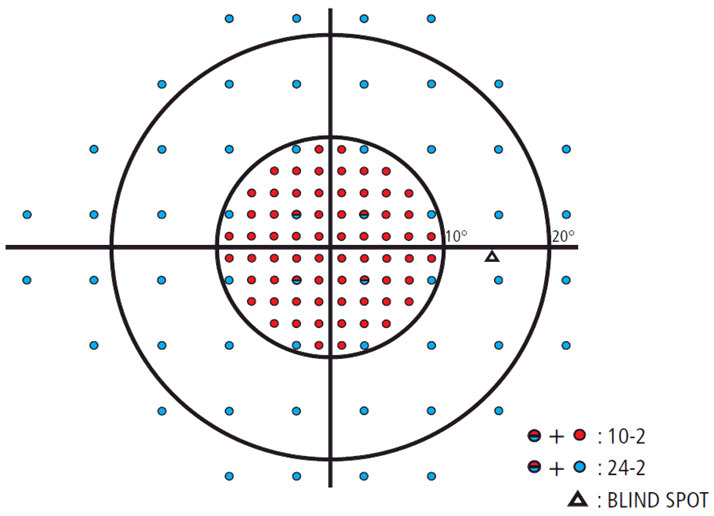
Figure 6: Right Eye Visual Field. Blue Dots represent 24-2 test points, Red Dots represent 10-2 test points, and Red-Blue Dots represent shared points between 24-2 and 10-2 tests.
To increase the efficiency of diagnosing visual field defects involving fixation, the logical approach would be to combine the popular 24-2 test pattern with some 10-2 points. Hence, the 24-2C test pattern was created. A team of expert vision scientists picked ten specific 10-2 points and added these points to the 24-2 test pattern.3 These ten points were determined to be the most susceptible to glaucomatous defects. The totality of the 24-2C Test Pattern was designed to give the most relevant clinical information.

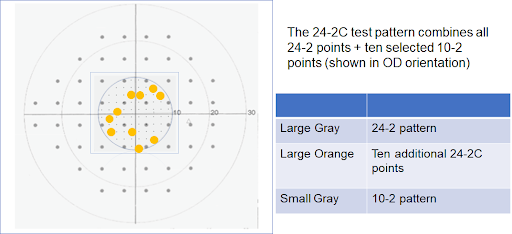
Figure 7: Right Eye 24-2C Field. The Yellow Dots represent the 10 additional points added to the traditional 24-2 pattern.
A poster presentation at ARVO in 2018 showed that the 24-2C increased the sensitivity of detecting visual field loss in the central ten degrees.4
Will adding ten additional points make this new test longer? No. The only testing strategy available with the 24-2C Test Pattern is the SITA Faster. In fact, the SITA Faster 24-2C is 20% faster than SITA Fast 24-2. This new SITA Faster strategy is only available for 24-2 and 24-2C.
Using AI for Visual Fields
A study several years ago showed that we can predict with reasonable accuracy what a patient’s visual field will show based on the OCT results.5 In many cases, the predicted visual field is very similar to the actual measured visual field. The following scenario is not available for widespread use yet, but imagine a future where our glaucoma patients will first get a baseline OCT. Artificial Intelligence (AI) technology would generate a predicted visual field based on that OCT. Then, the AI could use that predicted visual field to aid the visual field instrument and speed up the actual visual field exam. The potential use of AI in accelerating visual field exams could save a tremendous amount of time.

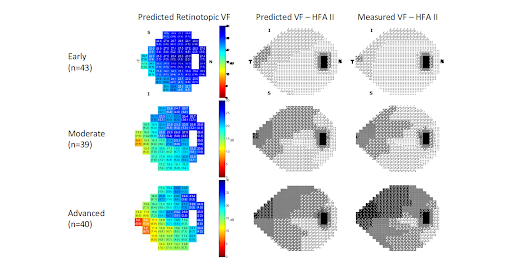
Figure 8: Predicted versus Measured Fields are very similar.
Integration of Testing Modalities
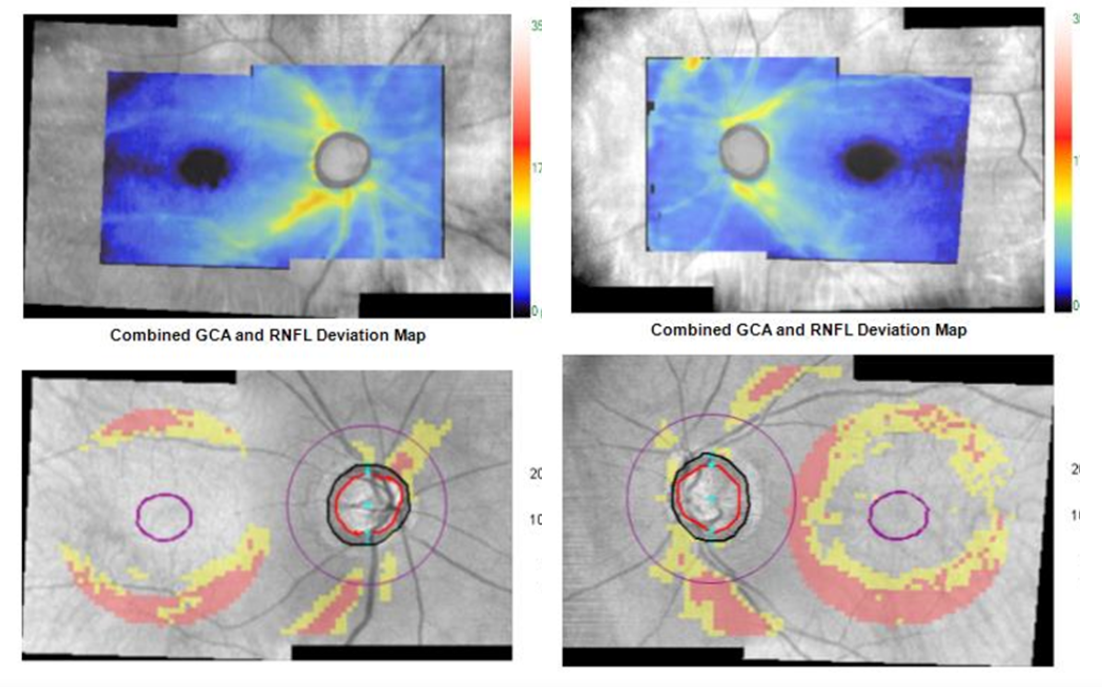
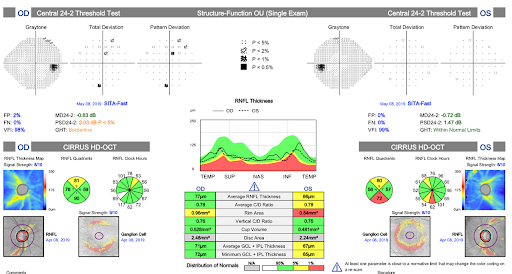
Zeiss OCT offers a PanoMap Analysis, where both the Ganglion Cell Analysis (GCA) and RNFL are combined into one image of the posterior pole (see Figure 9). Previously we had to look at the RNFL and Macula scan separately. Zeiss also offers a Structure-Function report which combines OCT and HVF results (see Figure 10).

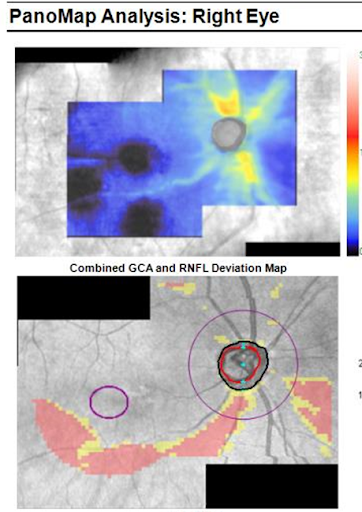
Figure 9: PanoMap Analysis. We can combine both the OCT scans of the RNFL and Macula into one posterior pole image for more complete structural analysis.

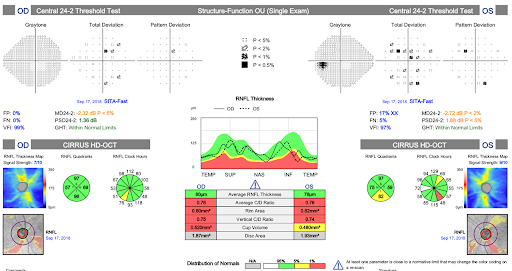
Figure 10: Structure-Function Report. Combining both Visual Fields and OCT scans into one integrated report makes review of glaucoma testing much easier.
Patient Cases
Case Report #1
Here is a case report highlighting the PanoMap Analysis and Structure-Function Report: An 84 year old White Male presented for a comprehensive eye examination. Ocular history was unremarkable. Best Corrected Visual Acuity was 20/25 OD and 20/25 OS. Pupils were normal. Pressures were 22 OD and 23 OS. Pachymetry was 549 OD and 537 OS. Gonioscopy was open. Dilated fundus examination revealed the following:

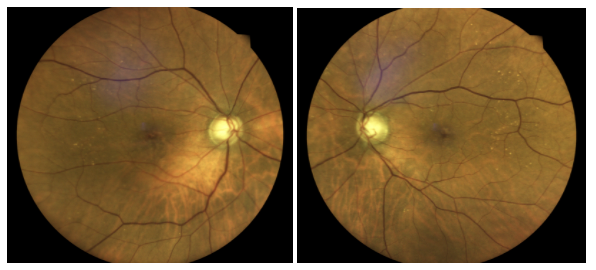
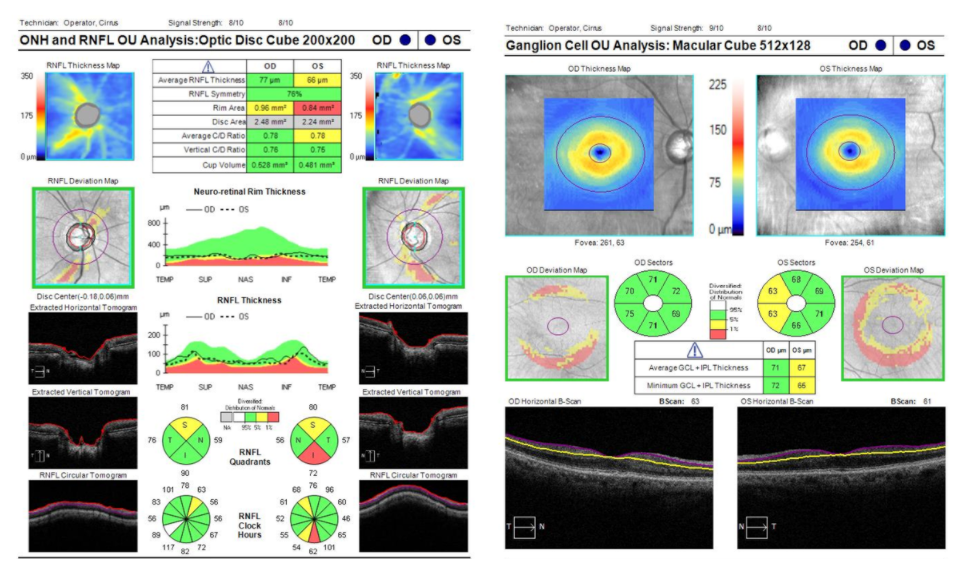
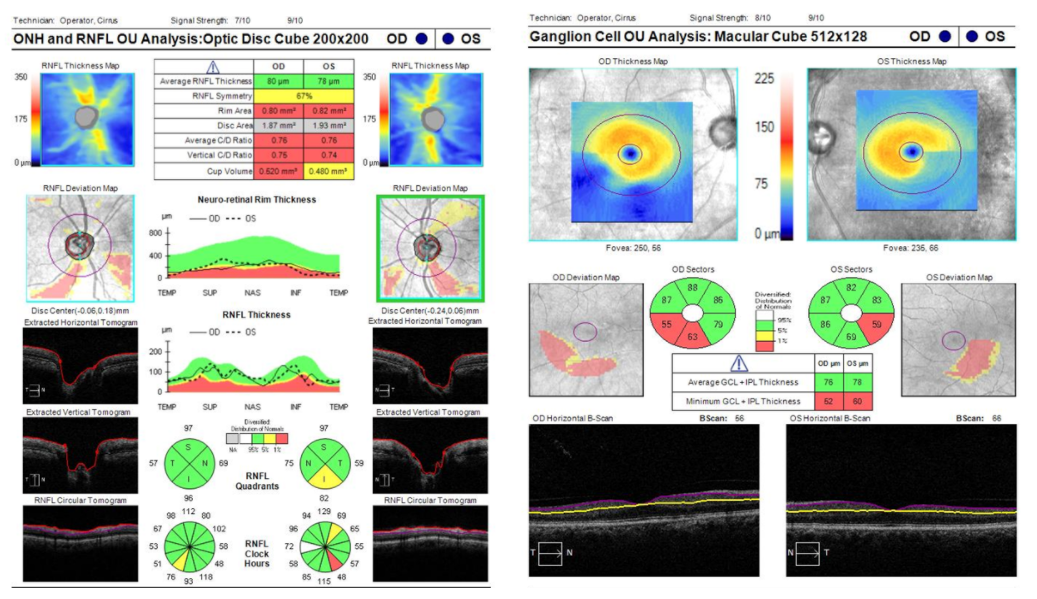
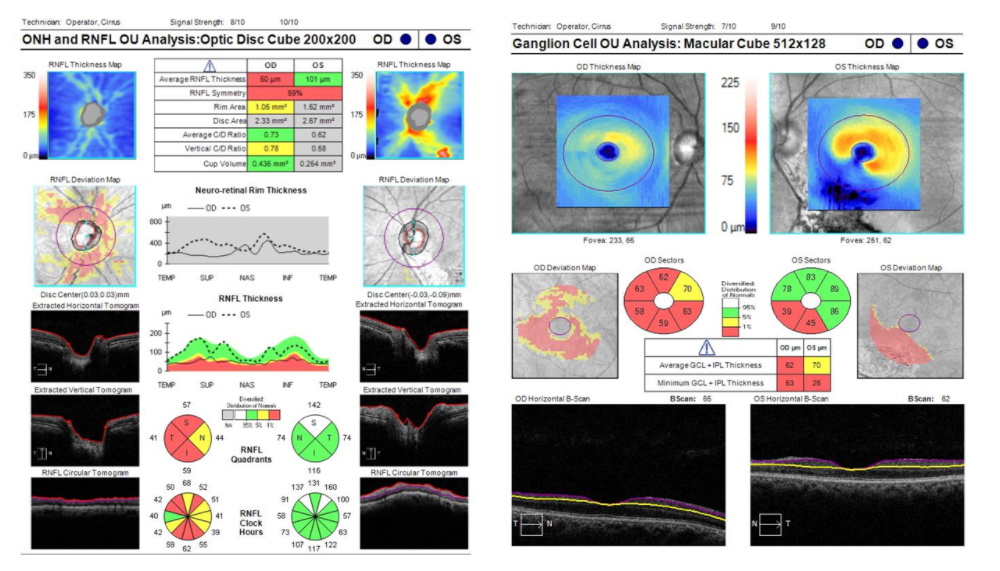
Due to the suspicious optic nerve head appearance not obeying the ISNT Guideline, an OCT of the RNFL and Macula were performed. The scans clearly show thinning in the peripapillary and macular regions, suspicious for glaucoma:

Due to the Pano Map Analysis, we can now integrate both of these scans into one image that gives us a more global view of the posterior pole:

We then obtained visual fields, which revealed a possible early superior arcuate defect OD and normal field OS. Instead of clicking back and forth between the HVF and OCT results, the Zeiss Structure-Function Report can integrate both structural and functional testing modalities:

The assessment was Primary Open Angle Glaucoma OS>OD due to thinner RNFL in the left eye. The plan was to start a Prostaglandin QHS OU with a target of 30% IOP reduction. A follow-up was scheduled in 1 month.
Case Report #2
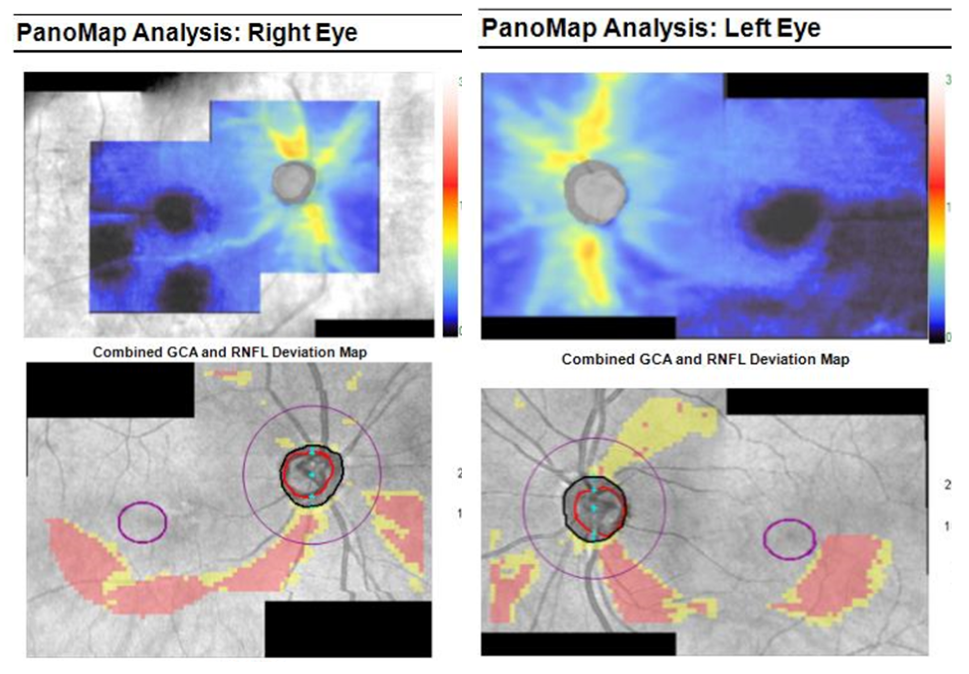
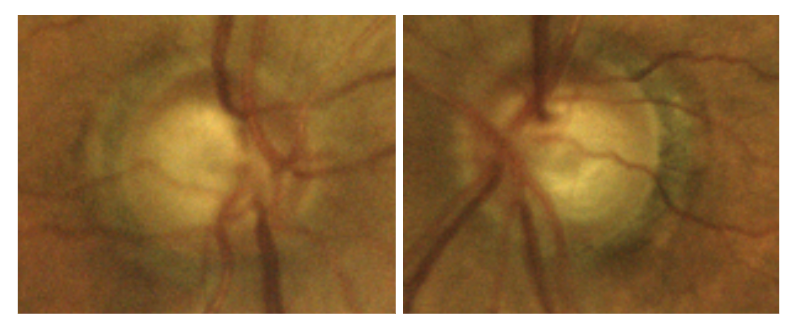
Here is another case report highlighting the Pano-Map Analysis and Structure-Function Report. A 70-year-old Hispanic Male presented for a comprehensive eye examination. Pressures were 26 OD and 26 OS. Pachymetry was 540 OS and 547 OS. Gonioscopy was open OU. Dilated fundus examination revealed the following:

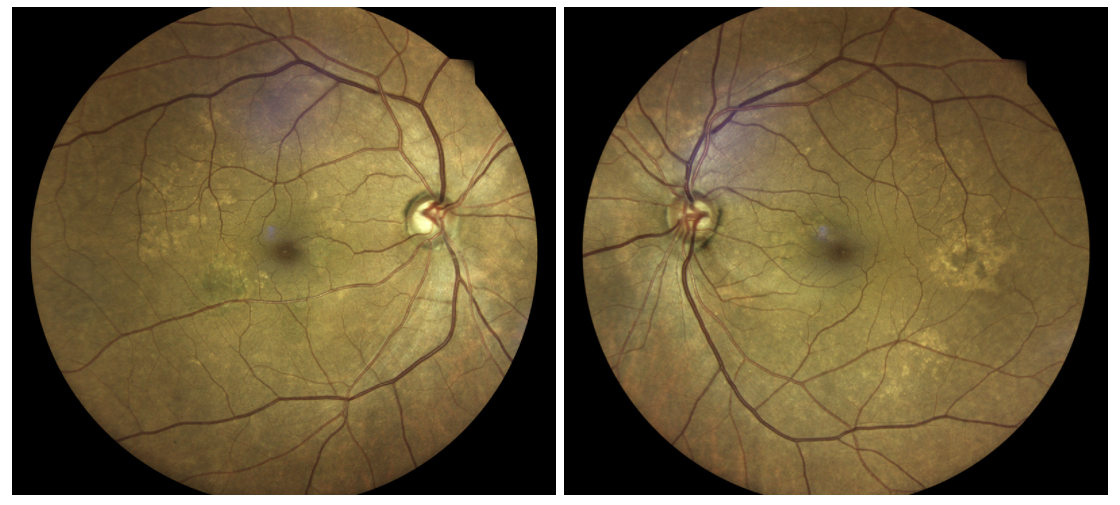
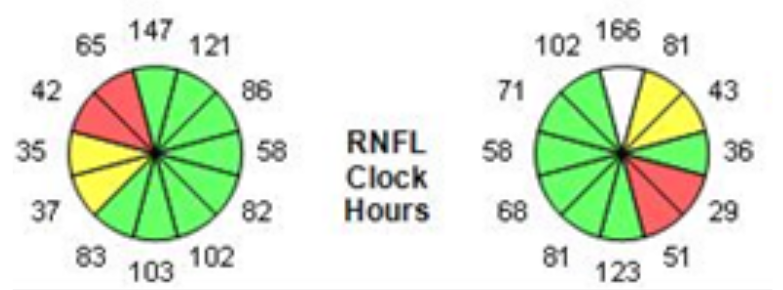
There is an apparent wedge RNFL defect inferiorly in the OS. This prompted an OCT of the RNFL and Macula, which revealed thinning in both eyes:

Again, the PanoMap Analysis is able to integrate both Optic Nerve and Macula Scans:

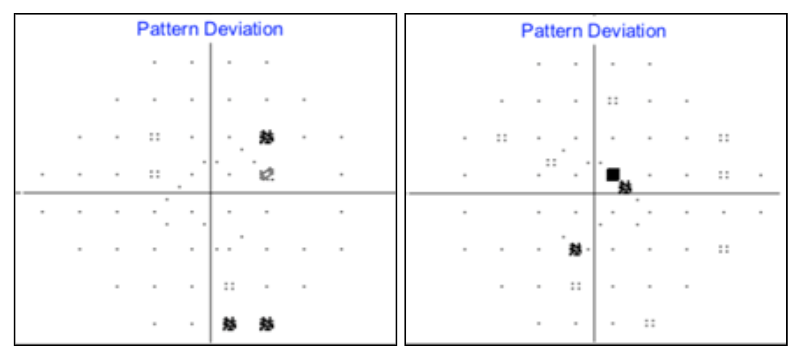
Furthermore, incorporating the HVF with the OCT can give us the Structure-Function Report:


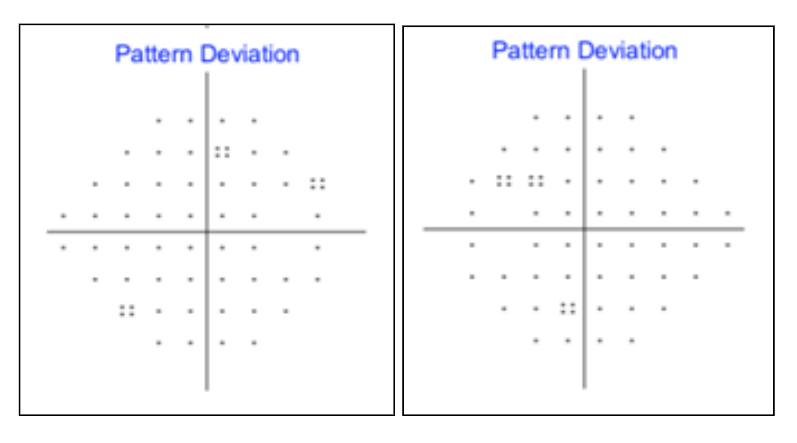
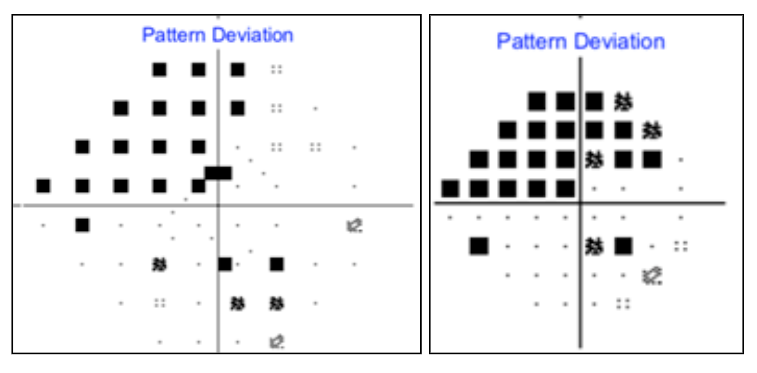
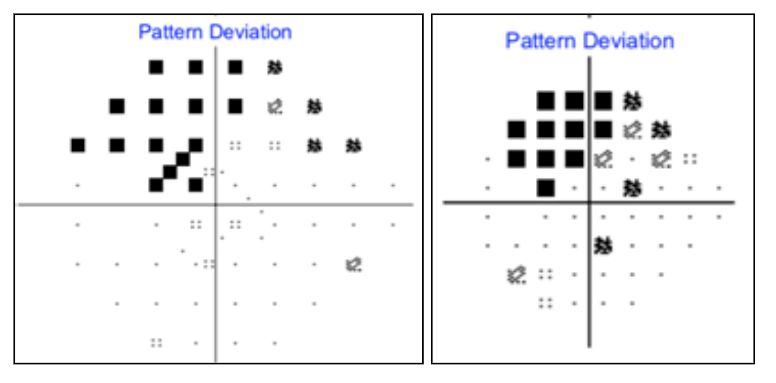
One can see that the 24-2 visual fields show mostly non-specific defects, possibly superior paracentral defects OU. However, if we perform the new 24-2C test, we can easily see the flagged superior-nasal paracentral defects in the left eye:

Case Report #3
Next is a case where there are abnormal nerves, abnormal OCT, but the HVF 24-2 is normal. An 82 year old Black Male presented for a comprehensive eye examination. His Best Corrected Visual Acuity was 20/25 OD and 20/20 OS. Pressures were 25 OD and 25 OS. Pachymetry was 554 OD and 550 OS.
Disc photos:

OCT RNFL:

HVF SITA Standard 24-2 essentially normal:

Is this pre-perimetric glaucoma? Not if we test with HVF 24-2C. HVF SITA Faster 24-2C reveals central visual field defects previously missed:

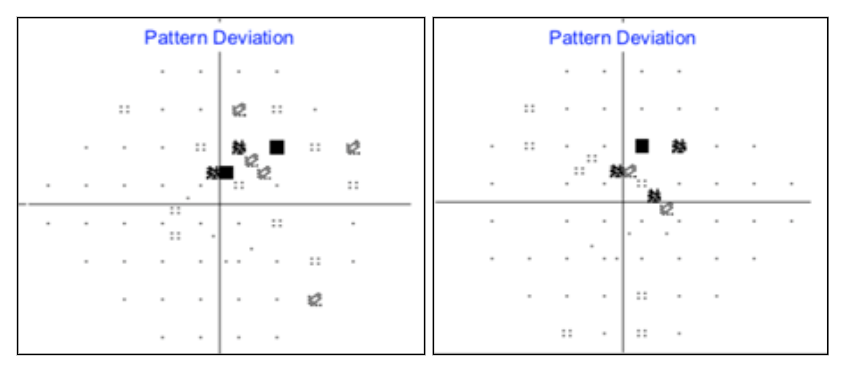
Previously, these central visual field defects were undetectable unless we performed the 10-2 field. This would have required the patient to return for more testing. This case clearly shows that the 24-2C can detect visual field loss not seen on 24-2.
Case Report #4
Of course, we need to perform a full comprehensive eye exam and make sure we do not overlook any retinal or macular disease that may be causing visual field defects unrelated to glaucoma. In this case, the patient has both glaucoma and a retinal problem. This is a 61 year old Black Male with a history of Primary Open Angle Glaucoma OD>OS for the past several years. There is a history of trauma to the left eye when the patient was young. IOP without medication was 32 OD and 30 OS. Pachymetry was 555 OD and 550 OS. Visual Acuity was 20/20 OD and 20/20 OS. Pressures were 12 OD and 11 OS on Latanoprost QHS OU and Brimonidine/ Brinzolamide BID OU. Dilated fundus examination revealed the following:

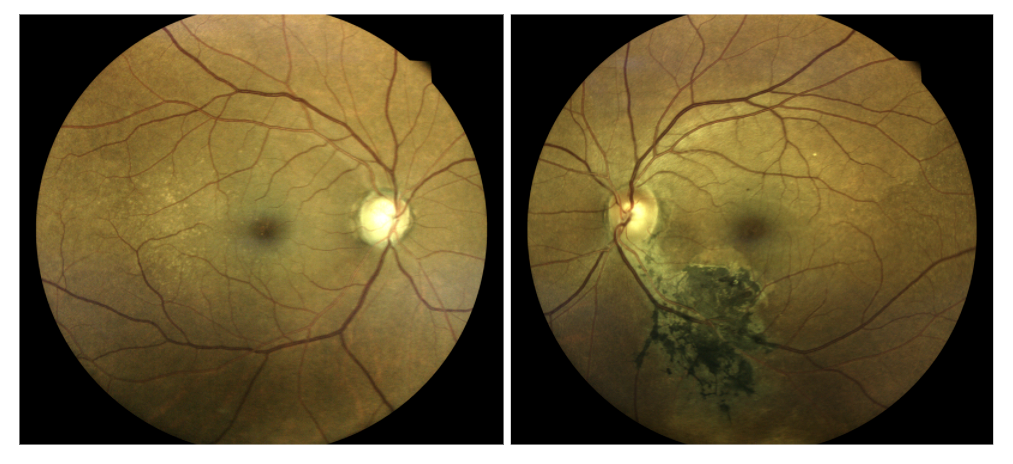
Note the advanced cupping consistent with glaucomatous optic neuropathy. Also note the densely pigmented chorioretinal scar inferior-temporal to the optic nerve head. Here are the associated OCT scans of the RNFL and Macula, showing marked thinning in both eyes:

Remember that the 24-2C test is a much faster test compared to the SITA Standard 24-2. The 24-2C also provides additional resolution of the central field not tested for on the SITA Standard 24-2.
Right Eye 24-2C (right), and Right Eye 24-2 (left):

Right Eye 24-2C (right), and Right Eye 24-2 (left):

Conclusion and Works Cited
Conclusion
If we adapt the new 24-2C testing pattern with the new SITA FASTER Strategy, we can diagnose glaucoma with much better resolution and save valuable time. Visual fields and the new technologies associated with them can combine with clinical exam and OCT to help diagnose glaucoma more effectively and efficiently.
Works Cited
- Wollstein, Gadi, et al. "Retinal nerve fibre layer and visual function loss in glaucoma: the tipping point." British journal of ophthalmology 96.1 (2012): 47-52.
- Heijl, Anders, et al. "A new SITA perimetric threshold testing algorithm: construction and a multicenter clinical study." American journal of ophthalmology 198 (2019): 154-165.
- Matthias Monhart, Gary Lee, Aiko Iwase, John Flanagan: Selecting additional test locations to enhance the 24-2 pattern using a scoring system, 7th World Glaucoma Congress 2017, P-WT-309
- Callan, Thomas, et al. "Evaluation of the SITA Faster 24-2C visual field test." Investigative Ophthalmology & Visual Science 59.9 (2018): 5111-5111.
- Bogunović, Hrvoje, et al. "Relationships of retinal structure and Humphrey 24-2 visual field thresholds in patients with glaucoma." Investigative ophthalmology & visual science 56.1 (2015): 259-271.

