


WHAT YOU'LL LEARN
Understand what widefield true color retinal imaging is and how it is utilized
Learn how to implement widefield true color imaging in the diagnosis, treatment, and management of ocular pathologies
Introduction
Widefield True-Color Imaging
It is understood that many indications of ocular and systemic disease are often found within the far periphery of the retina.1 Conventional dilated fundoscopy as well as standard digital retinal cameras can often fall short in capturing these subtle, yet clinically significant findings. This is usually due to one or more of the following reasons:
- The allowable field of view may not be wide enough to extend far enough peripherally. This can cause certain retinal findings to be missed.
- The resolution may not be high enough to bring ocular findings into a clear focus, which also increases the likelihood of findings being missed and increasing the possibility of artifacts.
- Details of specific retinal findings can be enhanced and thus observed more clearly when viewed with different wavelengths of light (i.e. filtered vs. unfiltered light), in which dilated indirect biomicroscopy and simpler retinal cameras may not be able to accomplish as effectively.
Taking these factors into consideration and understanding the relationship each variable has with the other, widefield true color imaging technology has successfully been able to capture high-quality images to effectively monitor early and subtle findings of disease and track changes over time by capturing high-resolution images, closely resembling the true appearance of the retinal surface with an expansive field of view.1,2,3 It can also capture fundus autofluorescence (FAF) images with blue, green, and infrared light to more carefully assess specific markers of pathology.
Taking a closer look at true color ultra-widefield fundus imaging
Field of view
The Zeiss CLARUS 500 has a total field of view of 133 measuring from the center of the eye, which is the equivalent sum of 7 standard fields of view, as determined by the Early Treatment of Diabetic Retinopathy Study (ETDRS).1,2 With 2 automontaged images, the CLARUS spans a total of 200 degrees, allowing for a much greater field of view into the outer peripheral areas of the retina without the presence of eyelash obstructions entering the image.2 Figure 1 outlines this below.

Figure 1: With 2 automontaged images, the CLARUS spans a total of 200 degrees, allowing for a much greater field of view into the outer peripheral areas of the retina.
True color fundus images
High quality images that closely resemble the true colors of the retinal surface. True color fundus imaging enhances the ability and the accuracy in diagnosing and monitoring ocular disease. Specifically, optic disc abnormalities, retinal lesions and choroidal nevi can be evaluated with greater confidence.
True color images are generated by sequential illumination of broad spectrum red, green, and blue LED light. (figure 2).

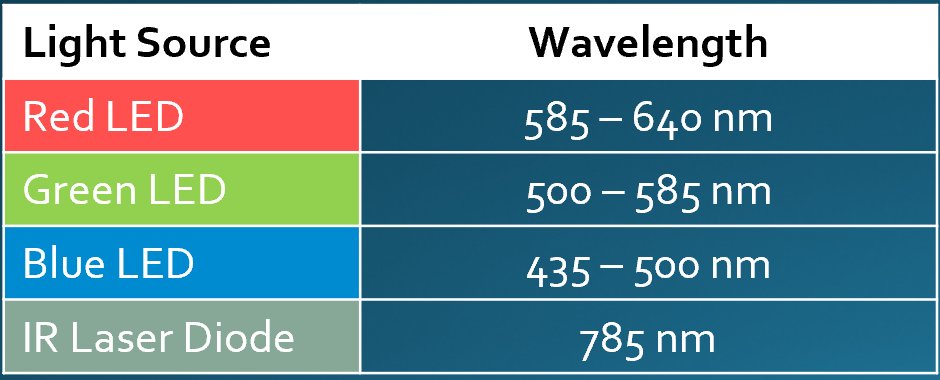
Figure 2: True color images are generated by sequential illumination of broad spectrum red, green, and blue LED light.
Fundus Autofluorescence (FAF)
Fundus autofluorescence (FAF) is a non-invasive imaging technique that detects fluorophores, which are naturally occurring molecules that become excited when they absorb specific wavelengths of light. In return, the fluorophores emit a certain wavelength which is captured by a filter, and collectively, these fluorophores produce a detailed image.2,3,4
The naturally occurring ocular fluorophore, predominantly located in the retinal pigmented epithelium (RPE) layer is better known as lipofuscin. When photoreceptor cells in the RPE begin to breakdown, their incomplete degradation produces a by-product of lipofuscin. The presence and accumulation of this fluorophore is then able to be spatially mapped to determine the cause and the extent of retinal degeneration as commonly seen with:
- Age-related Macular Degeneration (AMD)
- Central Serious Chorioretinopathy (CSC)
- Retinitis Pigmentosa (RP)
A normal, healthy fundus will be in a state of isoFAF. A compromised or metabolically stressed RPE will be in a state of hyperFAF, meaning there will be an excess of lipofuscin. However, it is important to note that there are specific structures within the fundus that will hyper autofluorescence, but this is not due to the presence of lipofuscin. These specific structures include the optic nerve head drusen and the sclera. The fundus can also be in a state of hypoFAF for two reasons: The first is that there may be a reduced density of lipofuscin due to RPE atrophy or from a dysfunctional RPE. The second reason may be due to a blocked signal which can be caused by blood vessels, fibrosis, or media opacities (i.e. corneal or lens irregularities).2,3
Currently, much of the FAF literature, especially with regards to AMD research, has been carried out primarily with blue excitation wavelength (435-500nm). There are however some shortcomings to this. For one, the FAF signal released from blue wavelength excitation tends to be absorbed by foveal carotenoids. This can make it difficult to properly image and monitor foveal disease. Secondly, the signal is also absorbable by the lens of the eye. The presence of media opacity results in poorer image quality. Green excitation wavelength (500-585nm) allows for less absorption by foveal carotenoids and media opacities thus potentially making this a better choice for patients with foveal disease. Although both techniques are similar, they are not considered to be interchangeable (see figure 3). The CLARUS 500 allows for FAF to be performed with both blue and green excitation wavelengths.2,3

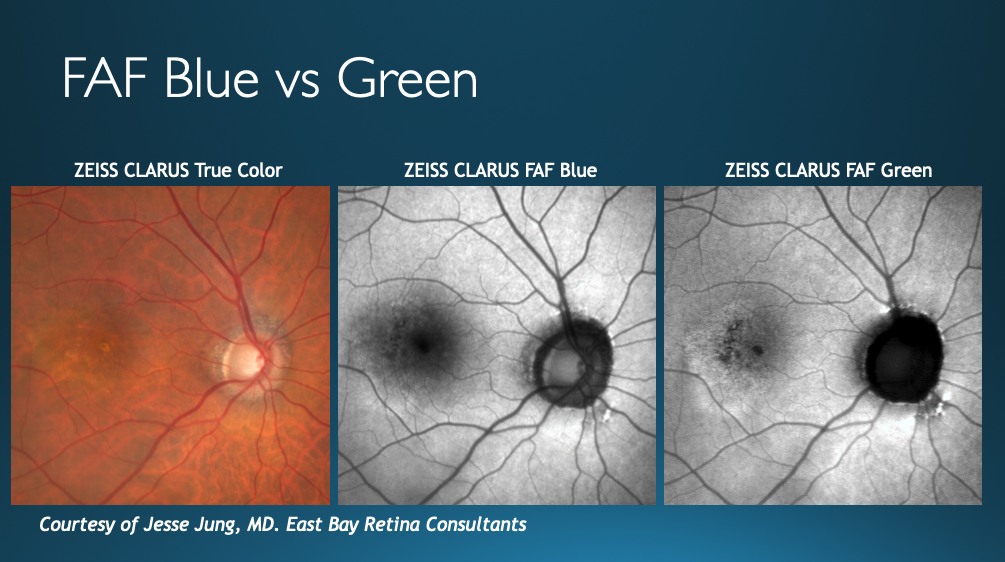
Figure 3: Comparison of a patient’s fundus captured with three different lights (broad spectrum for true color on left, FAF blue in center, and FAF green on right). With FAF Green, foveal details are much more prominent.
Anterior segment photography
Capturing images of the anterior segment with detail can be particularly useful for managing pathologies ranging from mild allergic conjunctivitis cases (figure 4) to more involved cases such as vasculitis with iris synechiae (figure 5).2,3

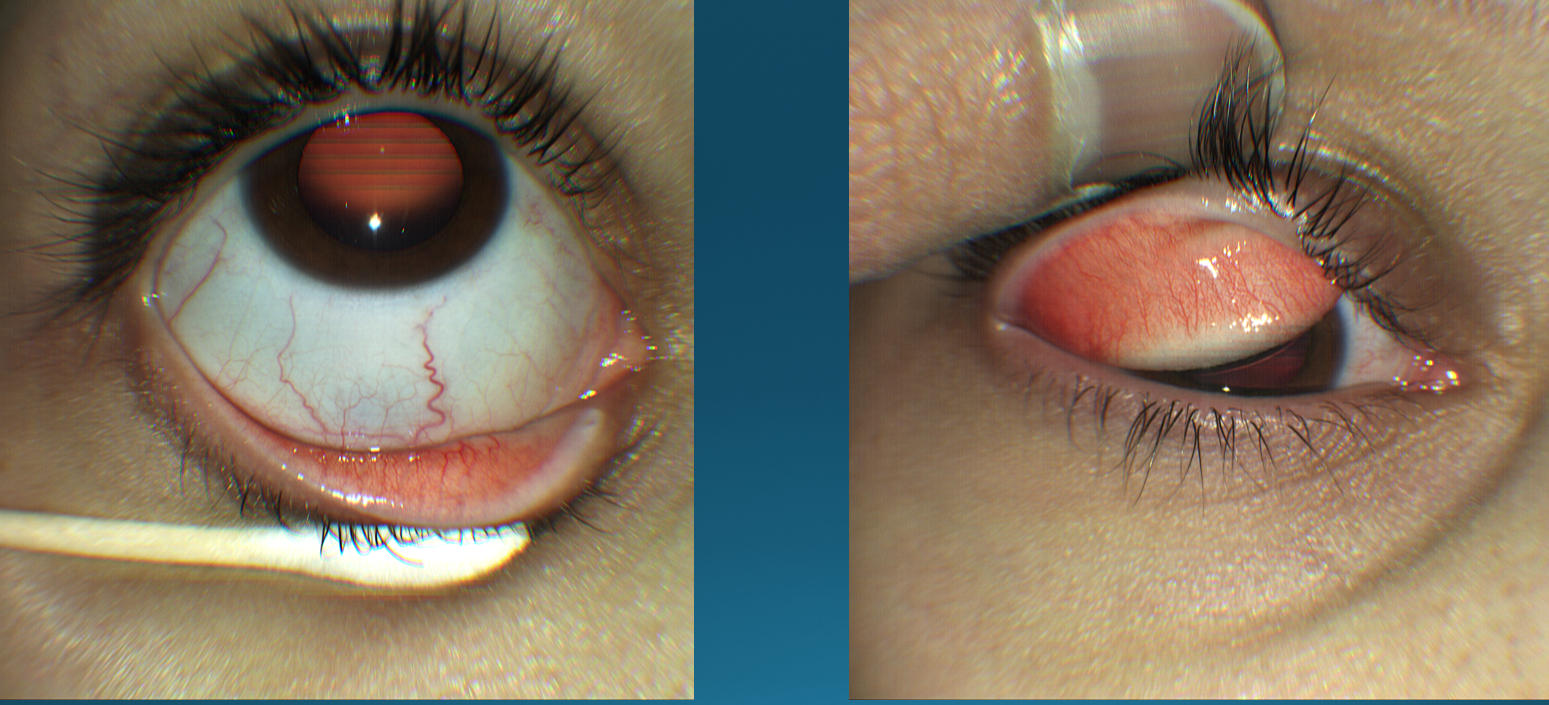
Figure 4: Anterior segment camera of the Zeiss CLARUS 500 imaging a patient with allergic conjunctivitis in its very mild stage.

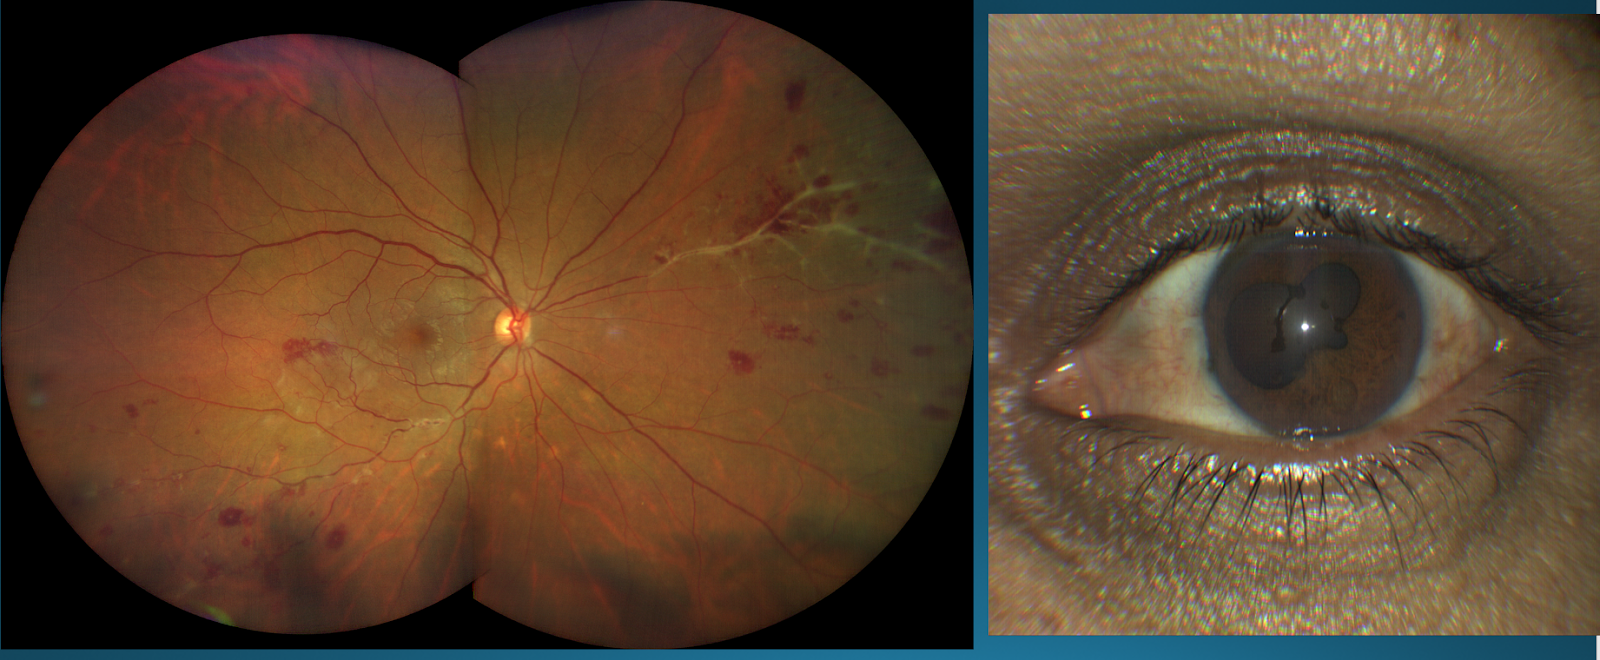
Figure 5: The Zeiss CLARUS 500 imaging a patient with retinal vasculitis (left) with anterior segment involvement. Anterior segment camera shows an image of iris synechiae (right).
Clinical applications: Peripheral disease
Introduction to clinical applications
Traditional retinal cameras are generally able to capture about 45-50 degrees outside of the posterior pole.3 This can make it difficult to image peripheral lesions that lie outside of this area with standard fundus photography. The CLARUS 500 produces a retinal image that can span 200 degrees wide, thus allowing these peripheral findings to be located and monitored much more easily. This can be especially beneficial to have in one’s practice when there may be more than one doctor involved in monitoring and treating a patient over time.2
This section will demonstrate how true color widefield fundus imaging can be used clinically for peripheral retinal pathology.
Chorioretinal scar
Consider figure 6 below:

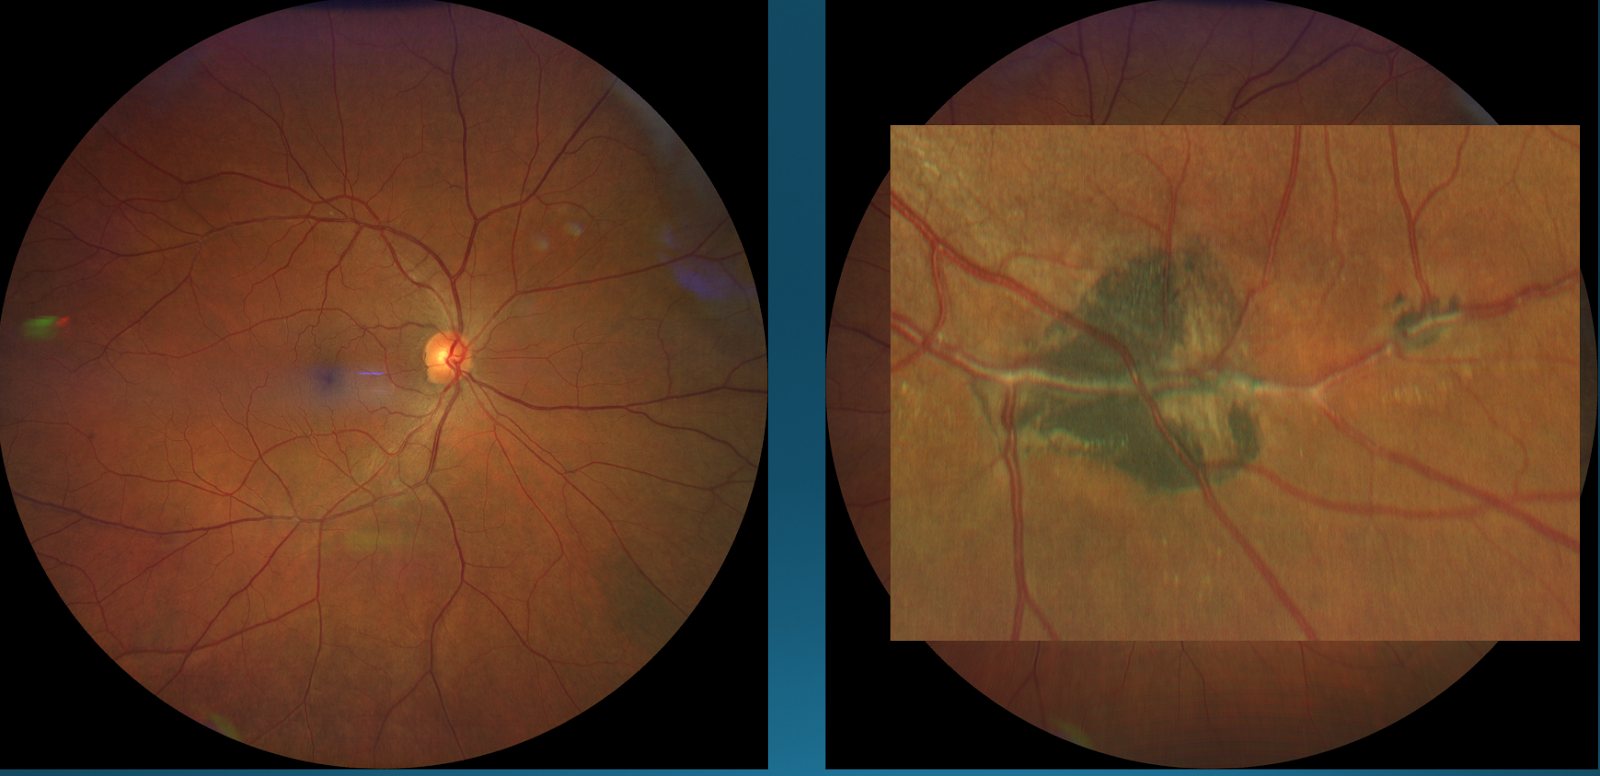
Figure 6: Right Eye (Left); Left Eye (Right)
On the right-hand side is a picture of a patient’s left eye revealing a chorioretinal scar. Is this scar active or inactive?
The scar in the left eye does not appear to present with any vitritis above it nor does it appear to have any retinal whitening surrounding it, both of which are characteristics of active retinal scars. Thus, judging from the appearance of this true-color image alone, one might conclude that this chorioretinal scar is an inactive lesion.2
Next, a comparison will be drawn for this chorioretinal scar under true-color light versus fundus autofluorescence in figure 7.

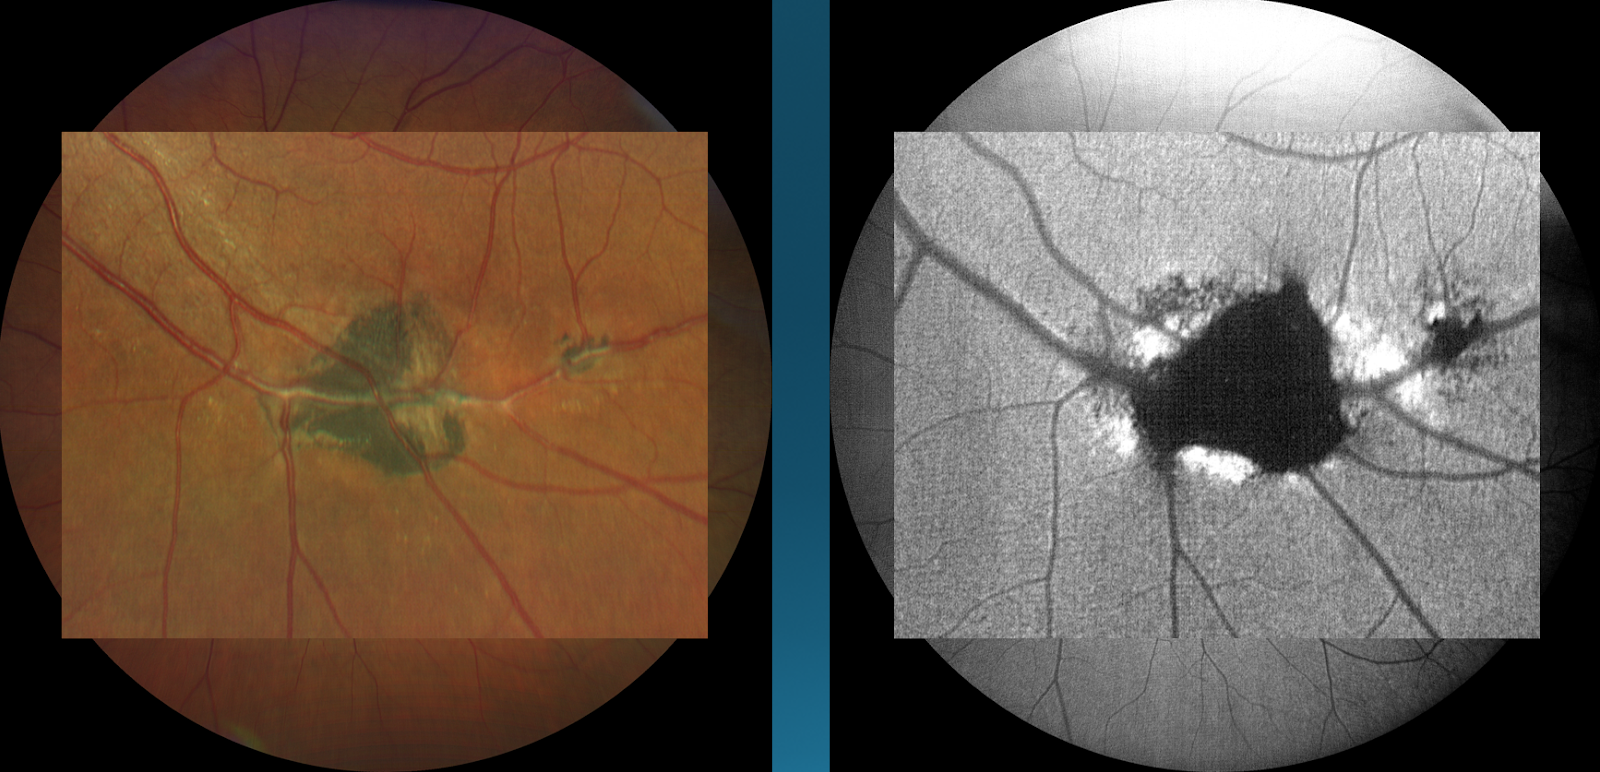
Figure 7
By looking at the same image under fundus autofluorescence, there is both hypo and hyper autofluorescence taking place. The blockage of light signal resulting in dark regions is collectively due to pigment hypertrophy and the damage done to the retinal pigmented epithelium as the scar was forming. What is of greater importance here, however, is the bright white areas that surround the scar. These areas of hyper auto fluorescence indicate that this lesion is indeed active, due to ongoing degradation of the retinal pigmented epithelium, hence altering the initial diagnosis that was a stable, inactive scar. This demonstrates the importance of fundus autofluorescence in monitoring the severity of retinal pathology with greater precision.2
Peripheral retinal hole
Consider the following case:
Case History:
39-year-old Caucasian female, who has never had her eyes dilated. She reports no history from prior eye doctors. She denies any systemic conditions.
BCVA with contact lenses:
- OD: 20/20+
- OS: 20/20+
- OU: 20/20+
Refraction:
- Simple myope, OU
Type of correction:
- Daily Disposable contact lenses
Slit lamp exam:
- Mild frothing of tear film, OU
Posterior pole:
Patient decides to go with the ultra-widefield Zeiss CLARUS 500 retinal photo (figure 8).

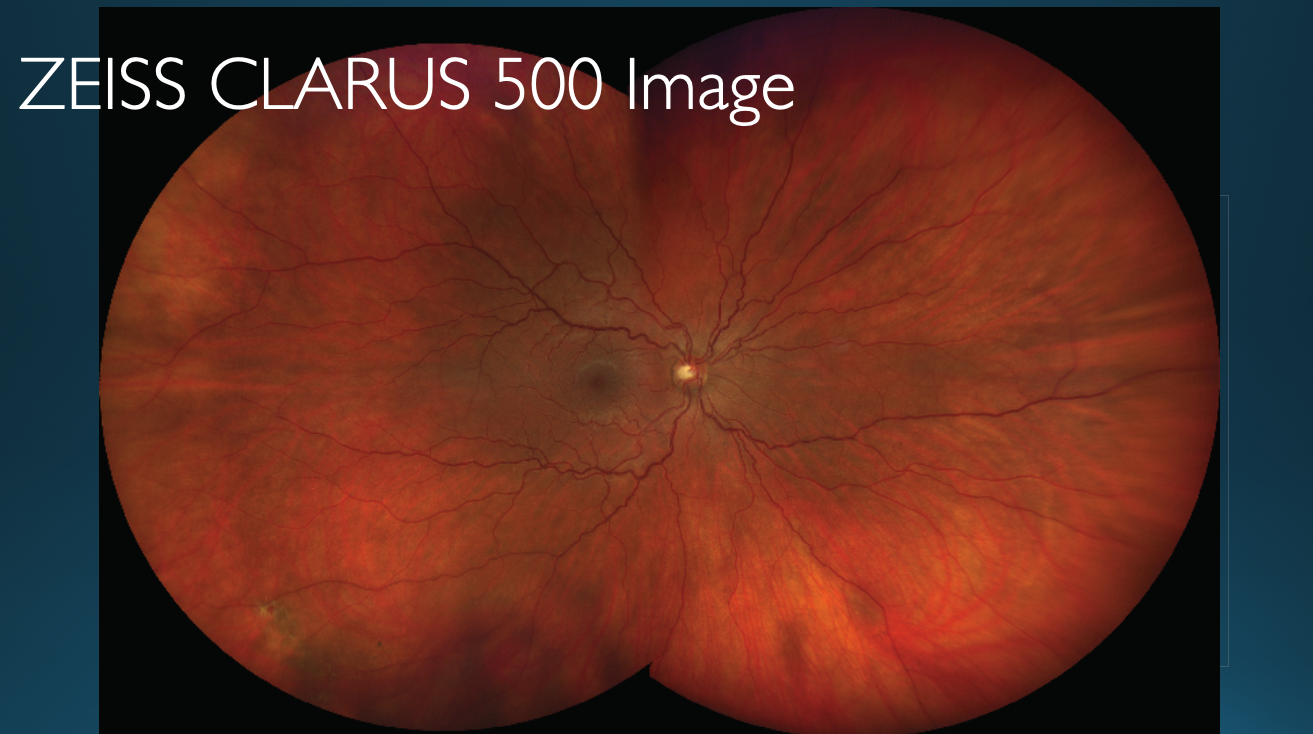
Figure 8
Figure 8 shows the photo of the patient’s right eye taken with the ultra-widefield camera and reveals a small atrophic retinal hole in the inferior temporal quadrant of the retina.2,3 Though this hole may not be of major concern given the way it presents, it is still important for documentation and monitoring purposes. This lesion would have had a high chance of being missed with standard fundoscopy and perhaps most other capturing technologies. Due to the expansive field of view, the far periphery was able to be captured.
Choroidal nevus
Consider the following case:
Case History:
55-year-old, Caucasian female, presents as a new patient that has been under the care of her sister-in-law and has recently moved. The patient reports a birthmark that was being followed by her prior doctor. The patient reports no other complaints and her medical and ocular history were normal.
Posterior pole:
Patient opts for an Ultra-widefield retinal image (figures 9-11).

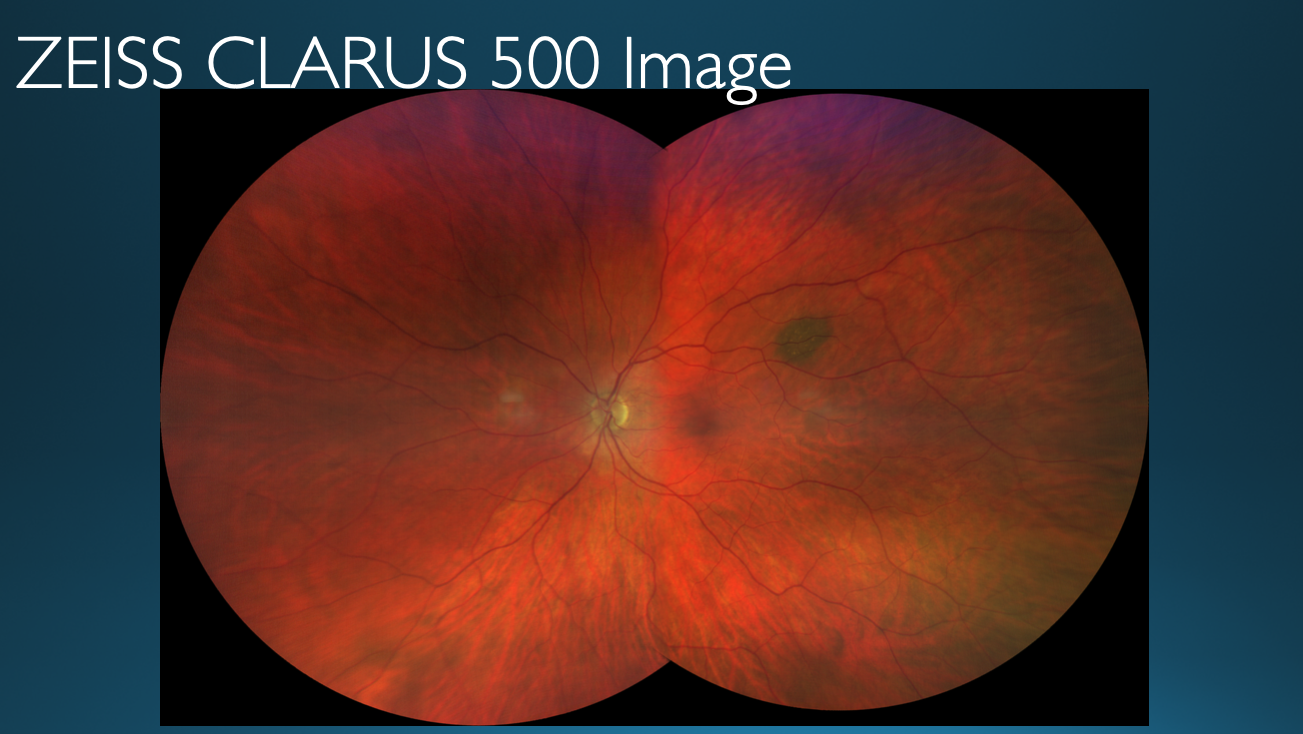
Figure 9: A choroidal nevus is seen in the upper temporal quadrant of the patient’s left eye

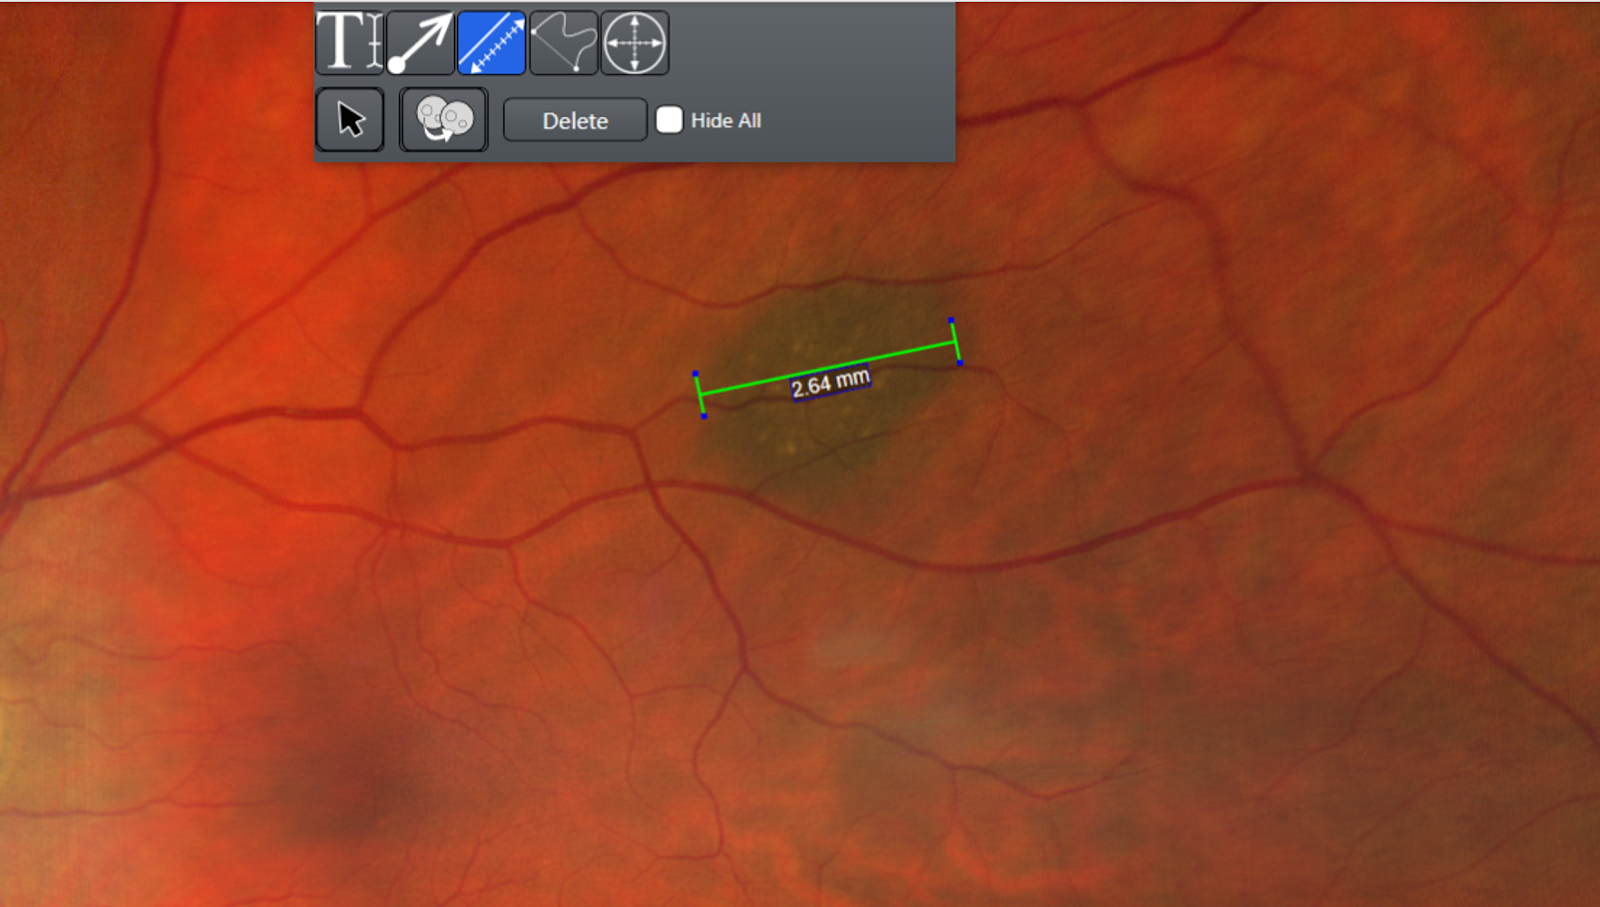
Figure 10
Allow for lesion measurement. Using the caliper function, a measurement can be taken to determine the size of a retinal lesion. This patient’s choroidal nevus measured out to be 2.64 mm.

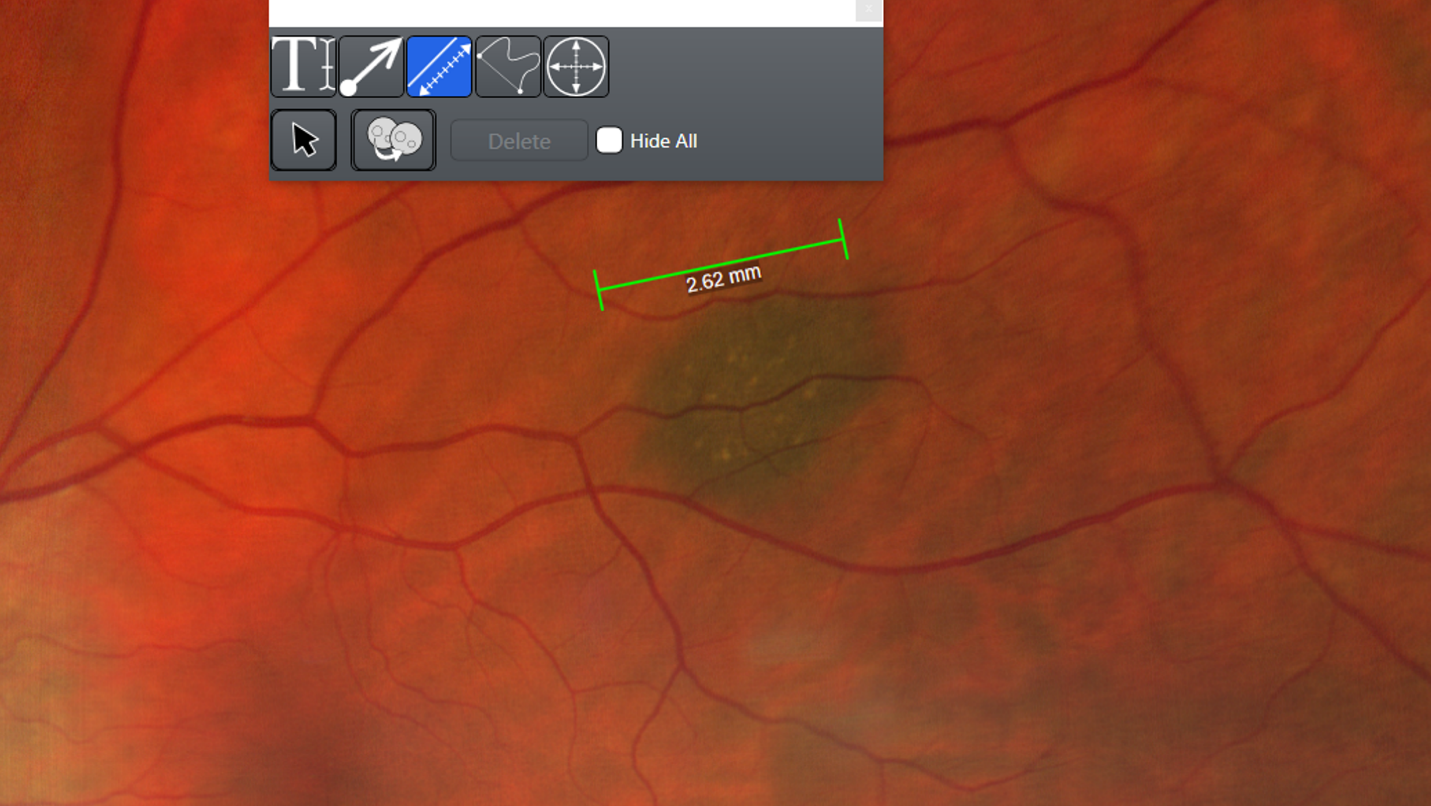
Figure 11
An important variable to determine when examining a lesion is its elevation. By dragging the existing measurement line to a new, adjacent area of the retina, without changing its original measured length, a new measurement is recorded. In this case, it measures to be 2.62mm. Since the original measurement was showing a total of 2.64mm directly over the choroidal nevus in Figure 10, it can be inferred that there is elevation present in this lesion.2,3 This is a great differentiating feature in monitoring retinal pathology which other technologies may not be able to offer.
Clinical applications: Macular and posterior pole disease
Epiretinal membrane and macular pucker
Consider the following case:
Case History:
61-year-old, Caucasian male presents for his 1 year follow up for LASIK and bilateral cataract surgery. He was very happy with the outcome of his cataract surgery.
BCVA:
- OD: 20/20-
- OS: 20/20
Slit lamp exam:
- Cornea: IntraLase corneal flap, smooth and even, OU
- Lens: Monofocal PCIOL OU
Posterior pole:
- Patient opts for true color widefield fundus retinal imaging (figures 12-14)

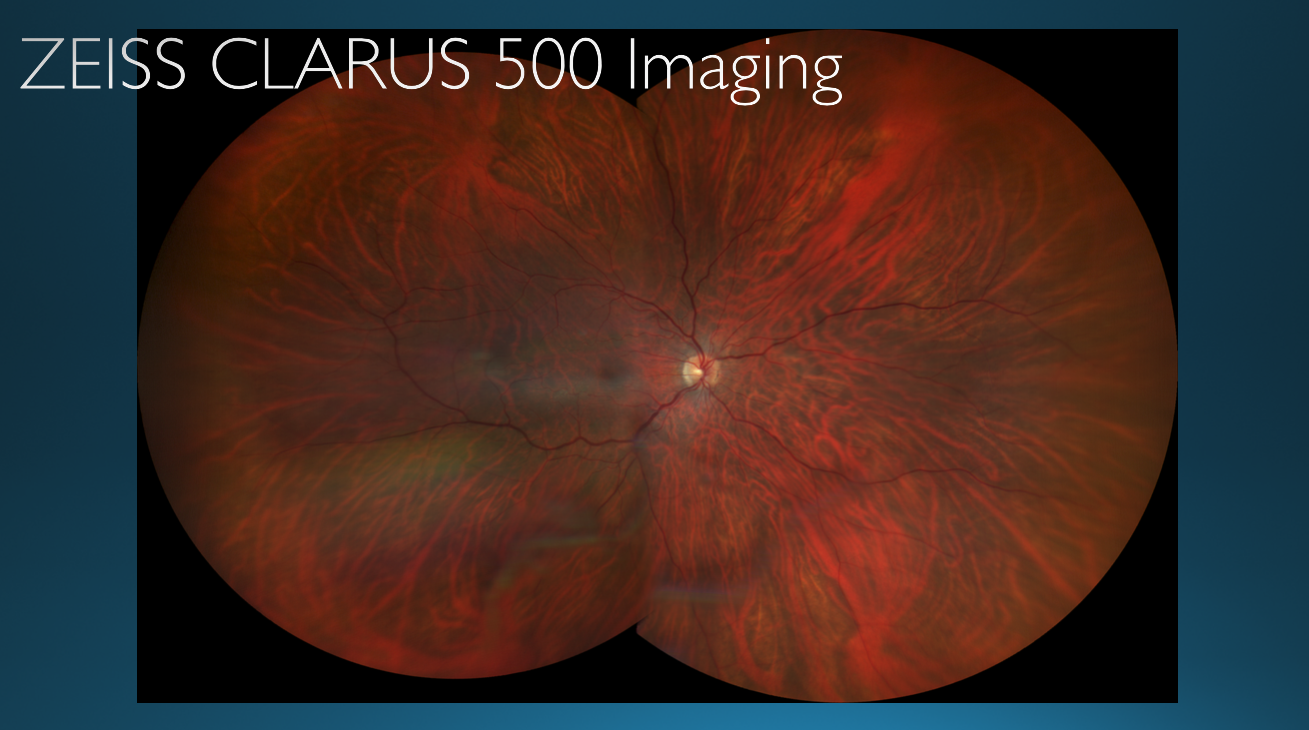
Figure 12
At first glance, this retinal image of the patient’s right eye appears to be normal.

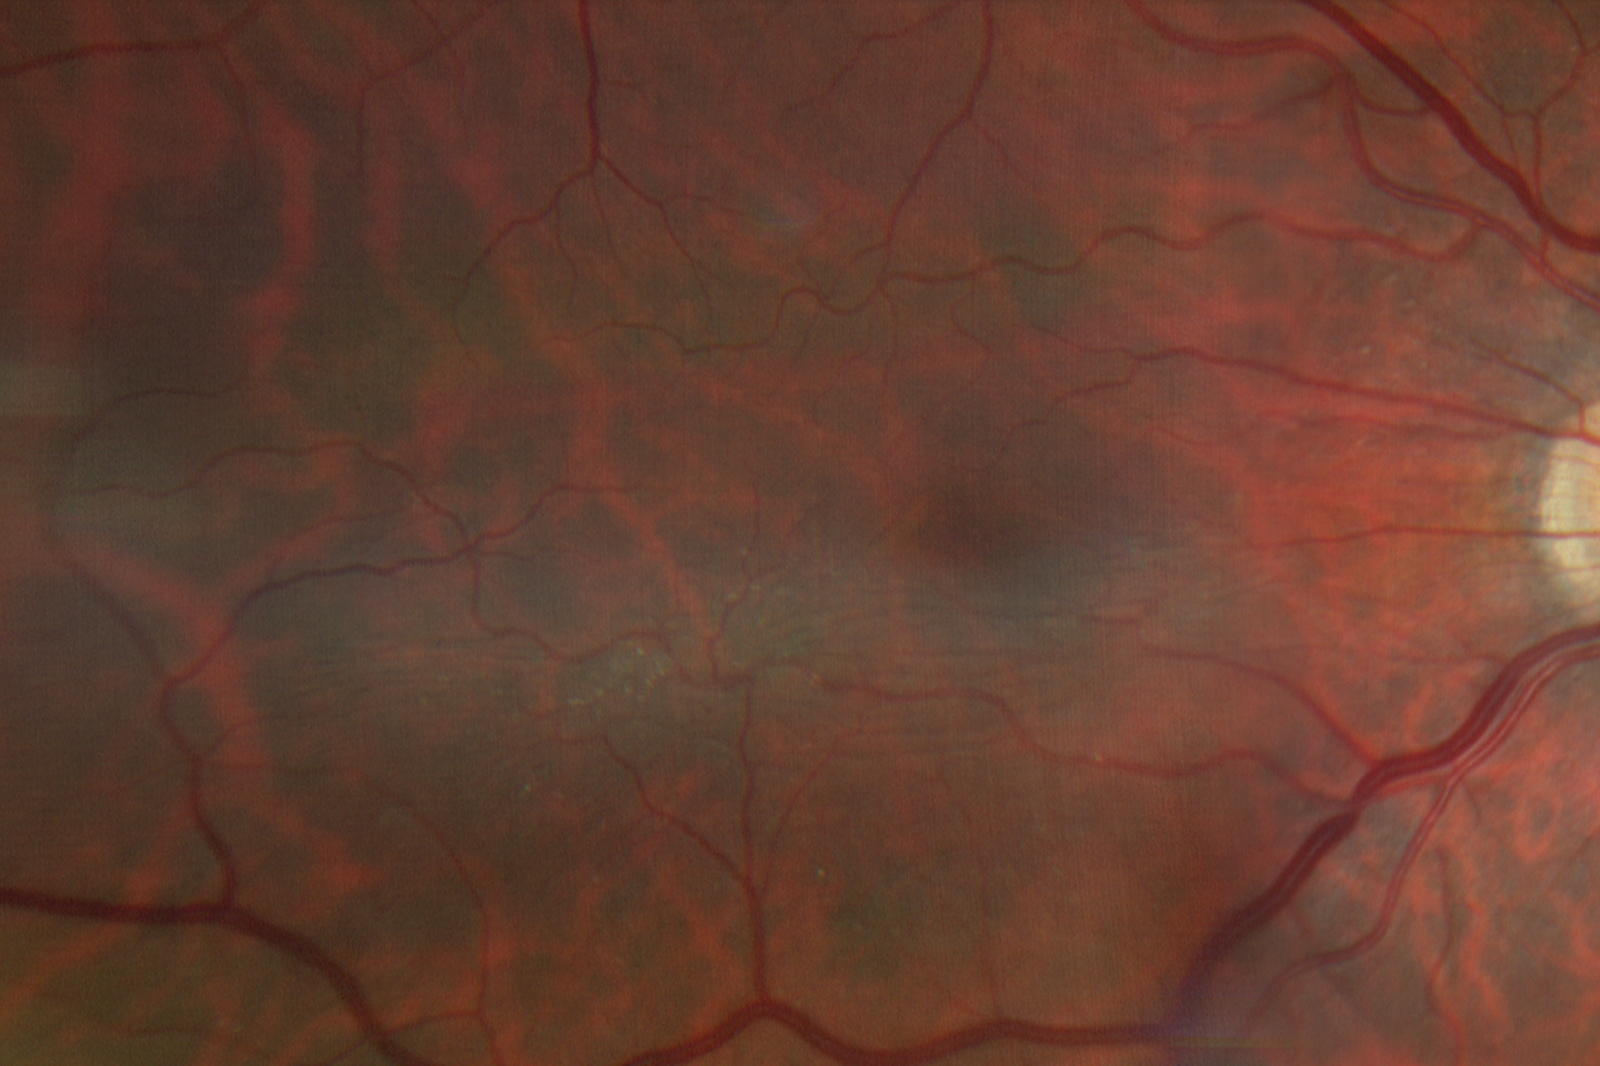
Figure 13
Upon zooming in on the patient’s macula in the right eye, an epiretinal membrane/ macular pucker is seen.

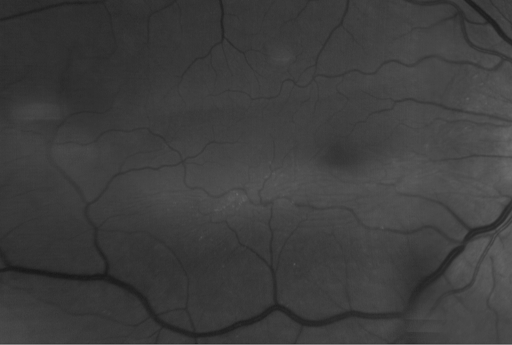
Figure 14: Epiretinal membrane being viewed with a red-free filter.
Diagnosis:
- Macular Pucker, not visually significant, OD
Treatment and management:
- Return to clinic every 6 months for repeat CLARUS 500 WF imaging
Take home message
There is no loss of resolution upon magnifying the image to get a closer look at the macula. This serves as a very effective tool when wanting to show patients specific details about their retinal findings.
Furthermore, in regards to this specific case, the patient often questioned why he did not see as well in one eye as compared to the other despite having cataract surgery in both eyes. The reason being that the unequal clarity of vision was not due to any inadequacies of his cataract surgery but simply due to the presence of a mild epiretinal membrane in which the widefield image was able to identify.
Central Serous Chorioretinopathy
Consider figure 15 below.

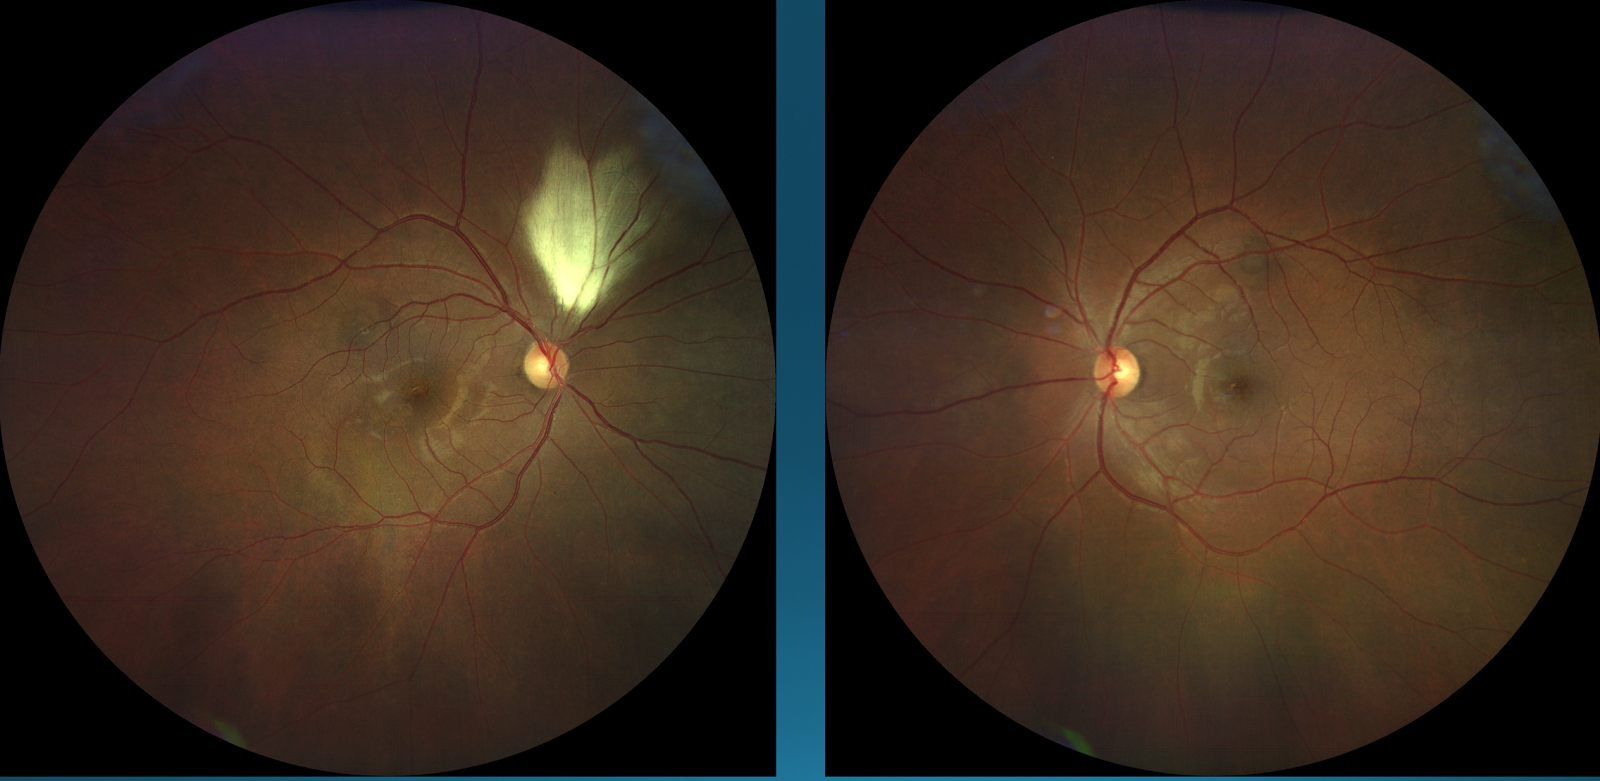
Figure 15: Right eye (left); Left eye (right)
Central serous chorioretinopathy (CSC), though usually found in the macula, can also be found just outside the posterior pole. There is CSC present centrally in both the right and eye left eye.

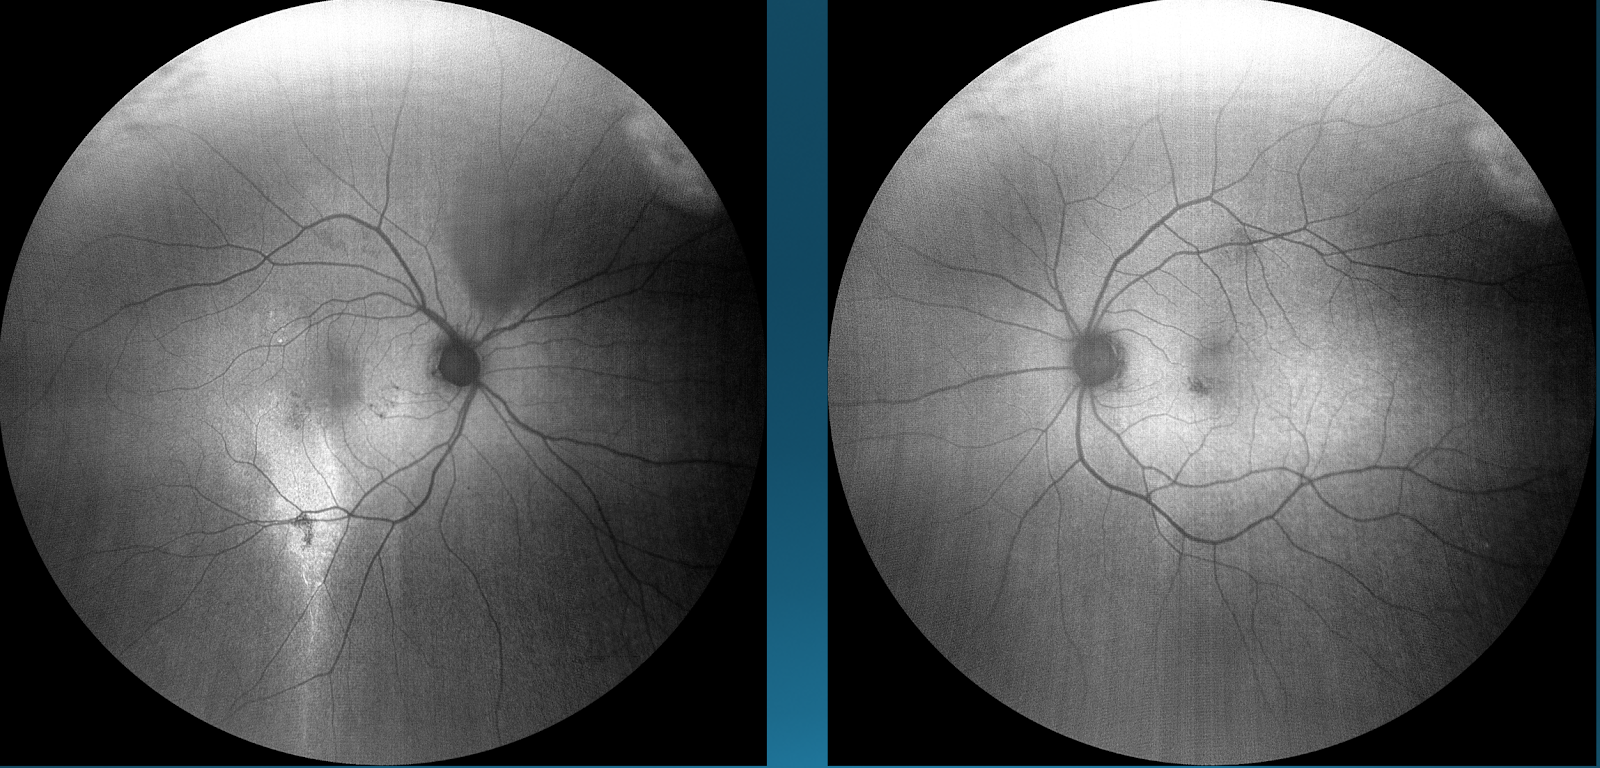
Figure 16: Right Eye (left); Left Eye (right)
When the same images are viewed under fundus autofluorescence, the extent of CSC is shown much more clearly. In the right eye, an area of hyper autofluorescence inferior to the macula can be seen, which corresponds to a descending track of fluid drainage from the macula to outside of the posterior pole region. In the left eye, there is a patch of hypo autofluorescence superiorly to the fovea (also seen in the right eye) which indicates there are different areas of fluid accumulation, respectively.

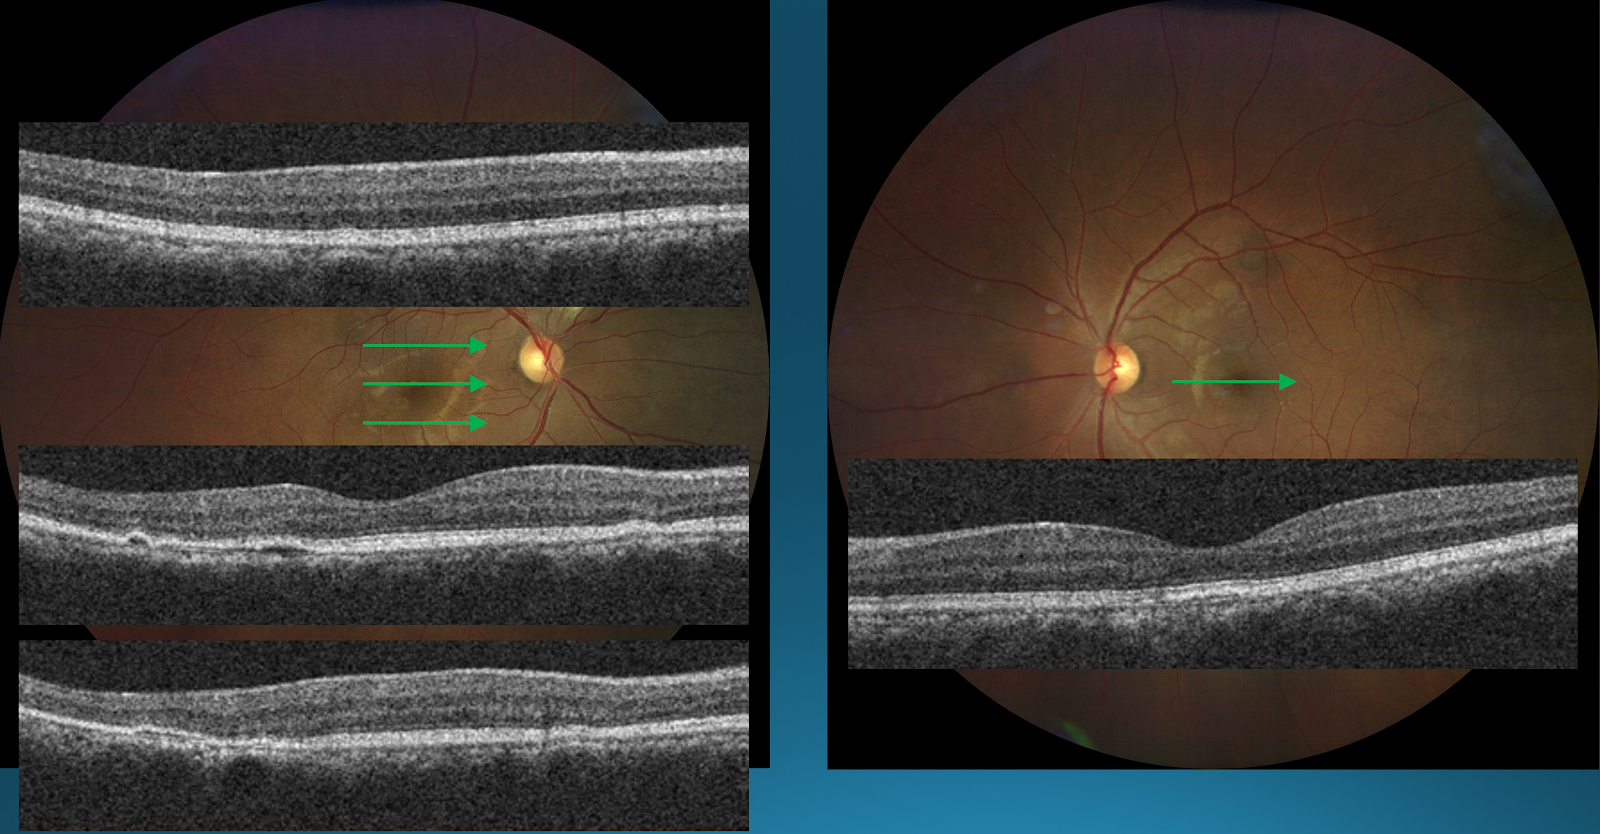
Figure 17: Right Eye (left); Left Eye (right)
OCT image of the right eye reveals there is outer retinal degeneration occurring superiorly to the macula, which increases as the OCT beam is brought further down other areas of hyper autofluorescence. For the left eye, there is a small area of hyper autofluorescence in the outer retinal layer which also indicates some degeneration.2
Consider figure 18 below.

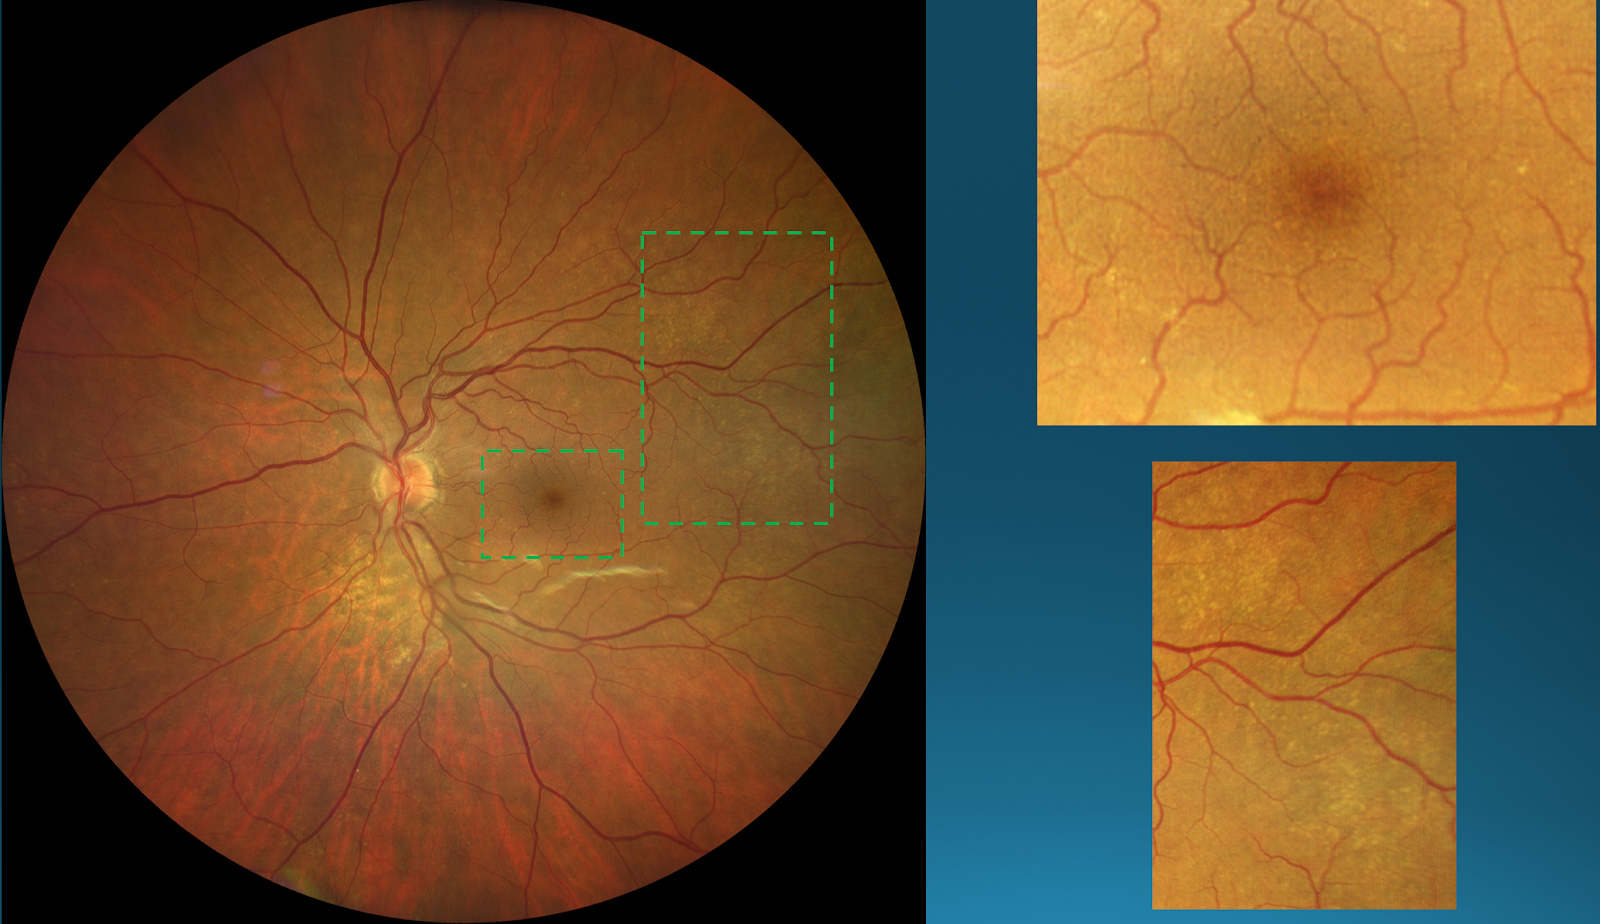
Figure 18
AMD is typically thought of as a macular disease. However, this photo reveals that drusen can be found both in the macula and in the peripheral regions. The presence of drusen in both areas often indicates the patient is at higher risk for developing vision-threatening disease.2
Diabetic retinopathy
Consider the following case:
Case History:
35-year-old Caucasian male presents for a progress visit on his Type 2 diabetes which he states is under control.
- 6.1% HbA1c, blood glucose this morning 110 mg/dL
- Managed with Humalog and diet
- Ocular history is unremarkable
BCVA & refraction at distance
- OD: -0.50DS 20/20+
- OS: -0.25DS 20/20+
Slit lamp exam:
- Normal, OU
Posterior pole:
- Opted for true color widefield imaging (figure 19)

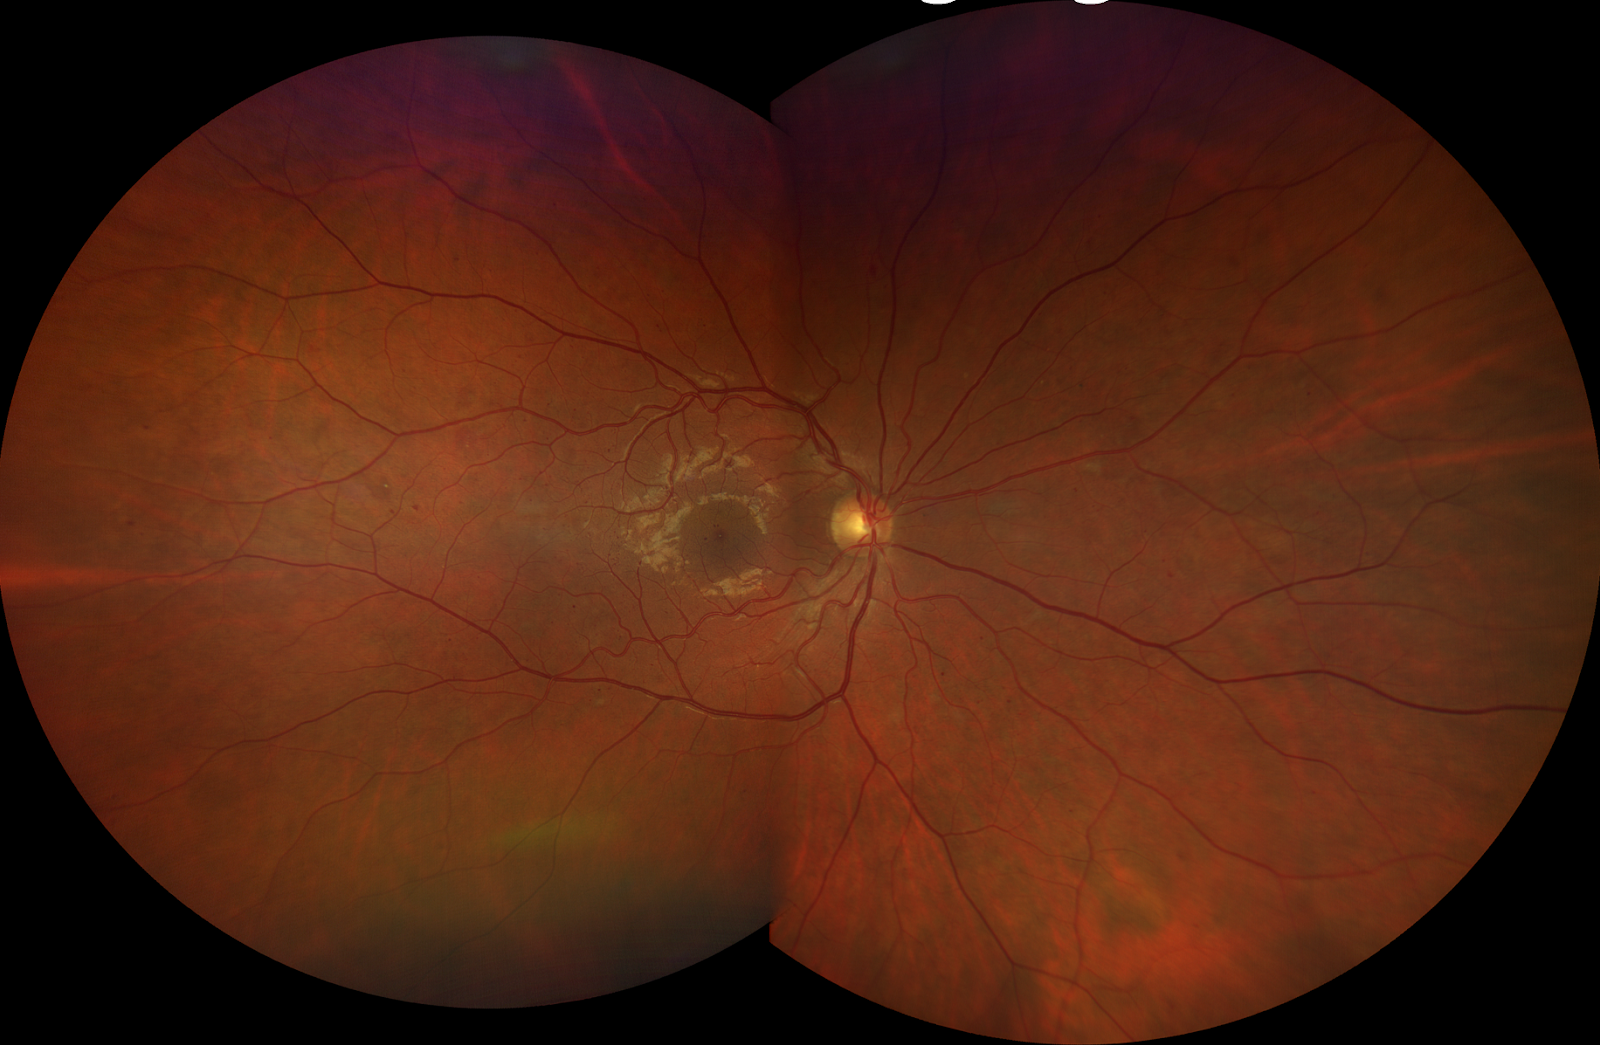
Figure 19
This image of the patient’s right retina reveals some dot-blot hemorrhaging upon closer look. It is important to note that because of the wide field of view and enhanced clarity, the location of specific hemorrhages (i.e. pre-retinal vs. retinal) can be identified. Because these hemes in particular are quite small, they run the risk of being missed with other forms of retinal viewing and hence, mild but active diabetic retinopathy can go unscreened.2
Optic nerve disease
Consider the following case:
Case History:
11-year-old, Caucasian male presents with blurry vision. He has been undergoing vision therapy for years and his parents are wondering if there is anything related to his complaints. His mother revealed that he had never been dilated and was concerned because of his “clumsy nature.”
Medical history:
- Broken right wrist after falling off bike
- Other wrist broken prior
Ocular history:
- Convergence insufficiency
BCVA & Refraction at distance:
- OD: -1.00 -1.50 x 090 20/20+
- OS: -0.75 -1.25 x 080 20/20+
Slit lamp exam:
- Blepharitis OU, otherwise normal
Posterior pole:
- Opted for true color widefield imaging (fig 20-23)

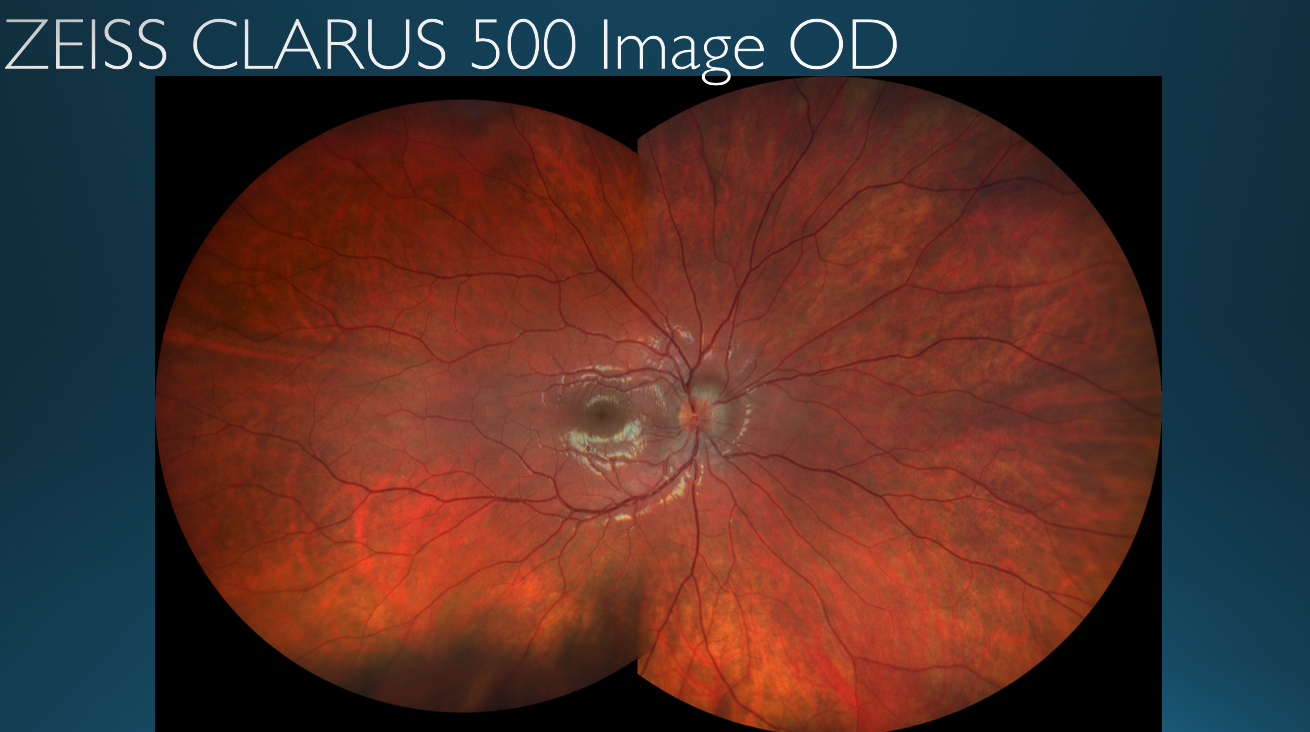
Figure 20 shows the patient’s right eye. There is optic nerve pathology.

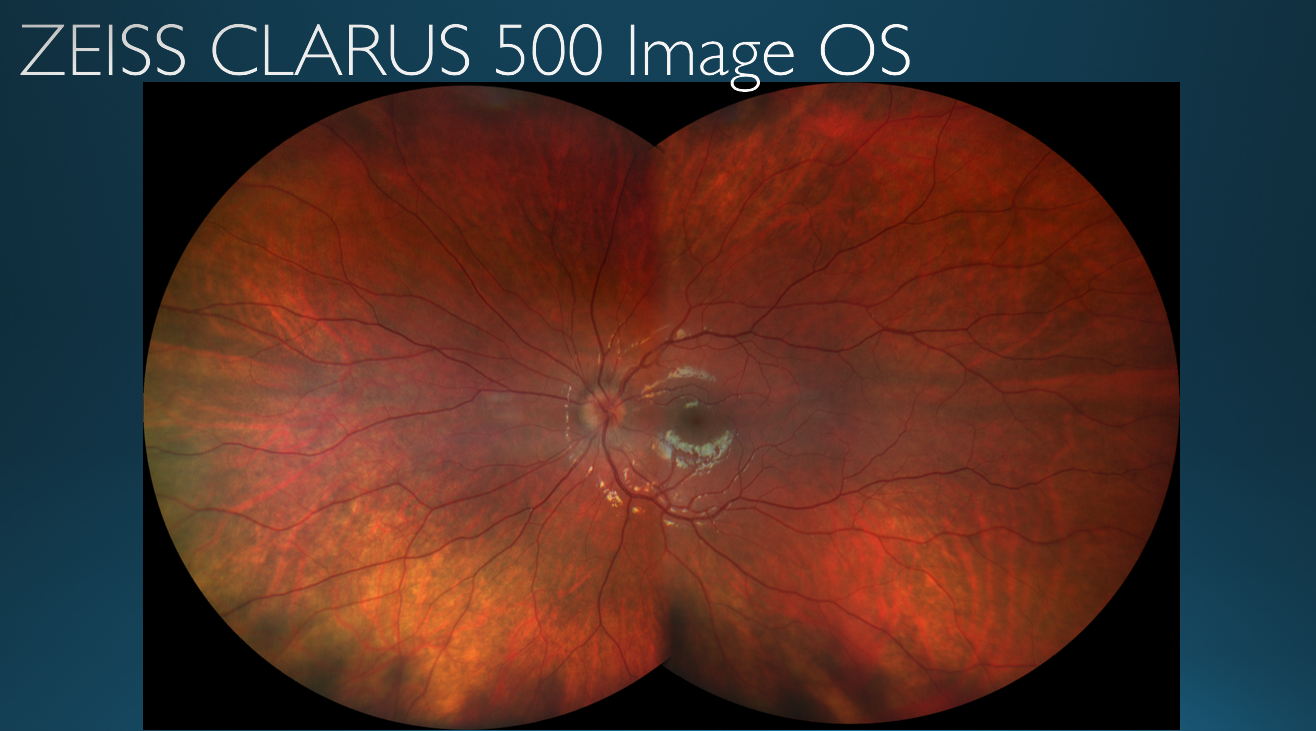
Figure 21 also reveals there is optic nerve pathology in the patient’s left eye

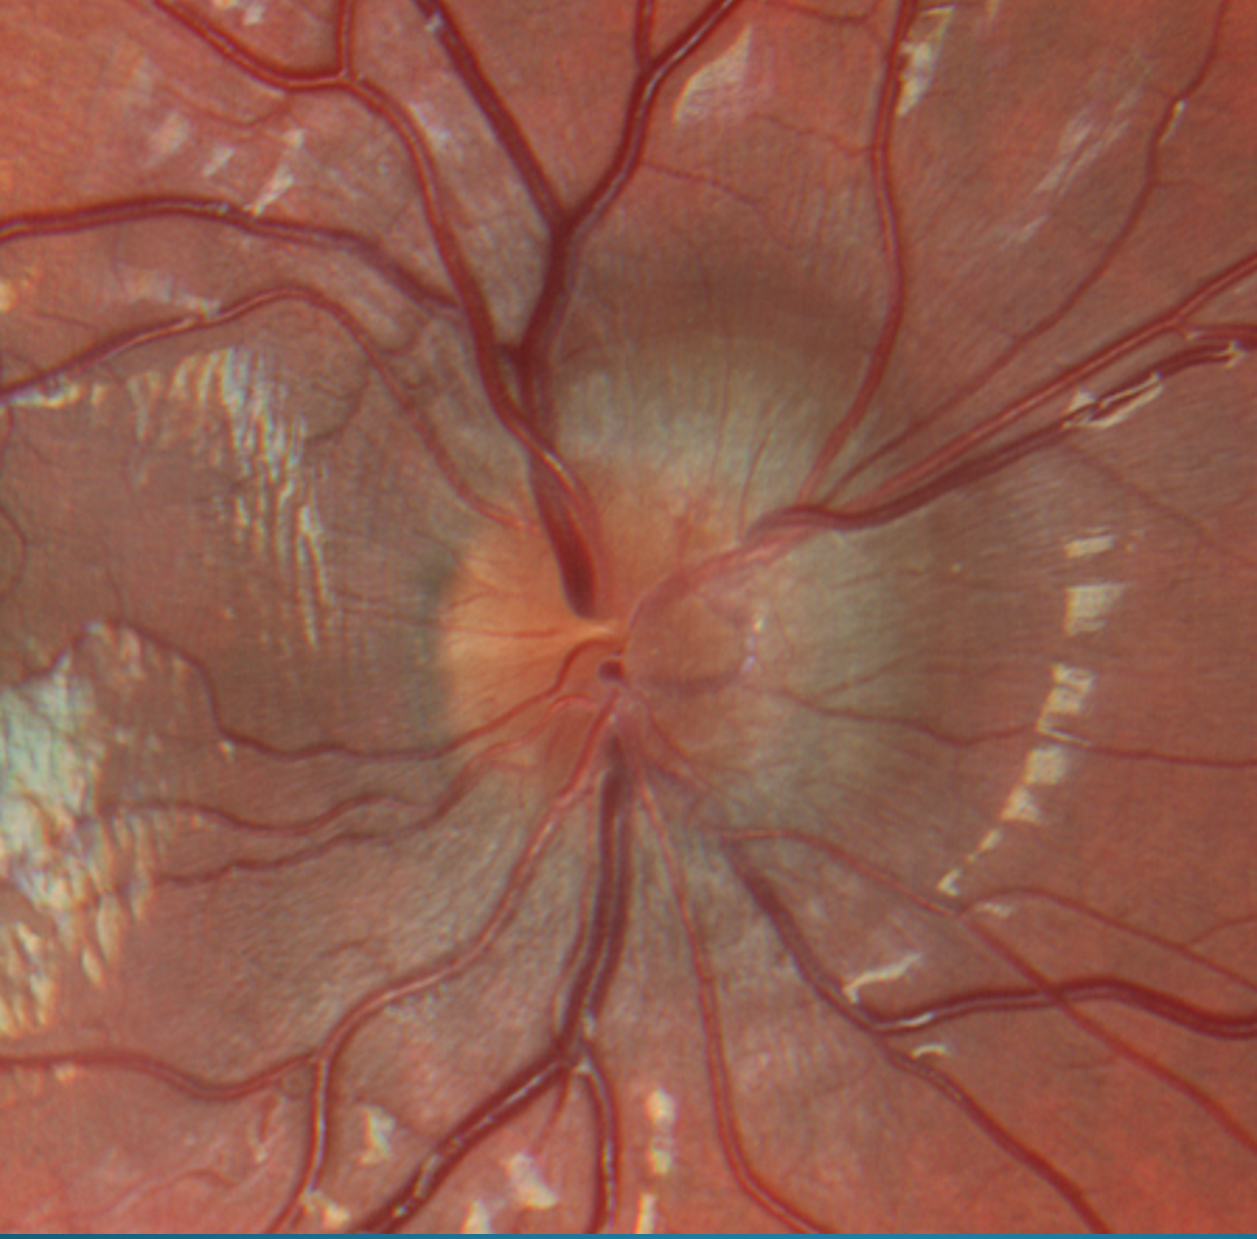
Figure 22
Close up view of the right eye’s optic nerve. Note that the resolution of the optic nerve has not been compromised despite the magnification of the image. The nerve presents with papilledema and blurred disc margins.

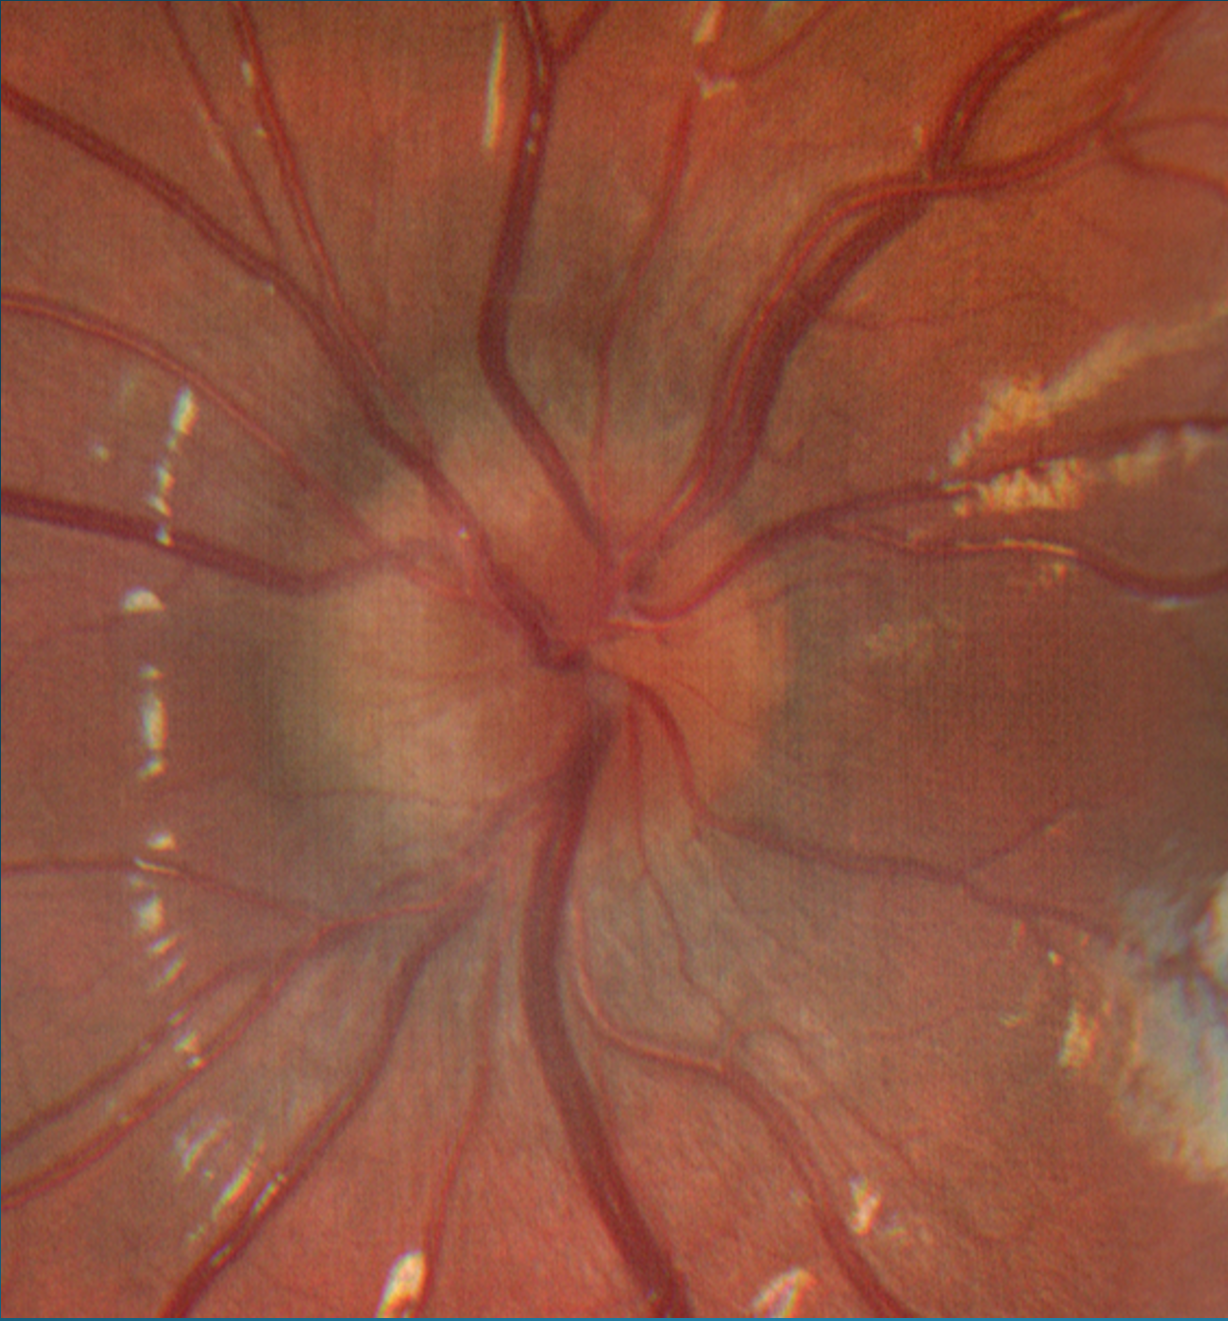
Figure 23 reveals similar presentation for the patient’s left optic nerve as compared to the right eye.
Testing:
- This patient was referred to the neurology department. Imaging was obtained.
Diagnosis:
A spinal tap confirmed increased intracranial pressure. This diagnosis explained why the child had been discombobulated for the past few months, why he was demonstrating very clumsy behavioral patterns, and hence why he may have fallen off his bike with two broken wrists.
Conclusions
The versatility of widefield true color fundus imaging allows this technology to be able to be used in multiple types of clinical settings. In a disease-based practice, true-color imaging serves as an excellent tool in monitoring pathology as it allows for enhanced photo-documentation and improved disease co-management. For practices where the demographic is generally healthy, young adults, there can be frequent resistance to routine dilated fundus examinations. In this case, widefield imaging allows for a high resolution and complete capturing of the retinal surface, ensuring confidence for both the patient and the provider.
The case examples discussed in this article reveal the remarkable diagnostic and disease management capabilities when using widefield true color imaging. It is important to note that findings discovered by this method can be further and more closely monitored with supplemental testing such as optical coherence tomography (OCT), B-scans, and ultrasonography for a truly comprehensive approach to ocular disease monitoring. Providing a full scope clinical setup for patients significantly improves the quality of care provided within clinical practice and thereby improves patient retention and overall experience.
References
- Carl Zeiss Meditec AG. Zeiss CLARUS 500. https://www.zeiss.com/meditec/int/product-portfolio/retinal-cameras/clarus-500.html
- Epshtein Daniel, Gee L. Kevin (2020). Ultra-Widefield 2.0: HD and True Color Imaging Webinar. https://drive.google.com/file/d/1G4t9H1skZ-bzANbeDNPnO5P1YZ4DJaTo/view
- Epshtein Daniel, Gee L. Kevin (2020). Ultra-Widefield 2.0: HD and True Color Imaging PowerPoint
- Yung, Madeline, Klufas, Micheal, Sarraf David (2016). Clinical applications of fundus autofluorescence in retinal disease. https://journalretinavitreous.biomedcentral.com/articles/10.1186/s40942-016-0035-x

