


WHAT YOU'LL LEARN
Know at what stage of the disease certain tools will be more useful in monitoring progression
Understand and interpret the Guided Progression Analysis reports on OCT and HFA for better clinical decision making
Introduction: How do we monitor glaucoma progression?
Historically, glaucoma progression was determined by evaluating the optic nerve in real-time and comparing it with previous fundus photography. The decision would then be made if the most recent picture indicated any change over time. Alternatively, practitioners would use visual field print-outs and inspect each field carefully to identify any flagged areas of field loss over time.
As the years went by, new developments came about to provide a better analysis of disease progression. Computer software has improved to where we can now identify clinical structural changes in microns long before the patient may experience any functional loss. The ZEISS CIRRUS RNFL OCT, Macula GCL/IPL OCT, and ZEISS HFA are clinical tools that provide a Guided Progression Analysis (GPA) report to highlight general and focal areas of progression in glaucoma patients over time.
Detecting change is important for patients diagnosed with glaucoma or as glaucoma suspects. This is a difficult task in itself, requiring periodic tests performed over years as change can occur anywhere in a patient’s lifetime. However, it becomes more difficult if you do not know how to appropriately interpret the analysis reports from these tools.
In this course we’ll review the common structural and functional tests by which glaucomatous progression can be identified at certain stages of the disease. We will also summarize the purpose of GPA and how to interpret the report, which will guide your clinical decision making on the treatment plan.
Monitoring progression
Disease stage matters
In the initial steps of glaucoma management, identify the stage of the disease. This will help to calculate their risk for progression, in addition to other factors1 such as:
- Age
- Intraocular pressure level
- Central corneal thickness
- Laterality of the disease
- Presence of disc hemorrhages
- Family history of glaucoma
- Comorbidities such as diabetes mellitus
Any glaucomatous progression may be measured by structural changes of the retinal nerve fiber layer (RNFL) at the optic nerve head and ganglion cell layer (GCL) at the macula using optical coherence tomography (OCT), or by functional changes noted as visual field deterioration using the Humphrey Field Analyzer (HFA). After you’ve established an appropriate baseline to be able to monitor for changes, the best method to detect progression will vary depending upon the disease stage.
Patients with mild to moderate stages of glaucoma at baseline are best monitored for progression in structural changes by RNFL OCT and GCL OCT. Patients with moderate to advanced stages of glaucoma at baseline are best monitored for progression in functional changes by HFA.
The Glaucoma Continuum, illustrated by Dr. Weinreb and colleagues,2 demonstrates that structural change often precedes functional change in the life span of the disease. Therefore, it makes sense that an OCT will detect structural changes to optic nerve head RNFL and macular GCL several years before visual field defects appear on the HFA. The average macular GCL thickness loss has shown to be detectable in all stages of glaucoma,3 therefore it may be beneficial to use GCL OCT longer than expected when compared to RNFL OCT.

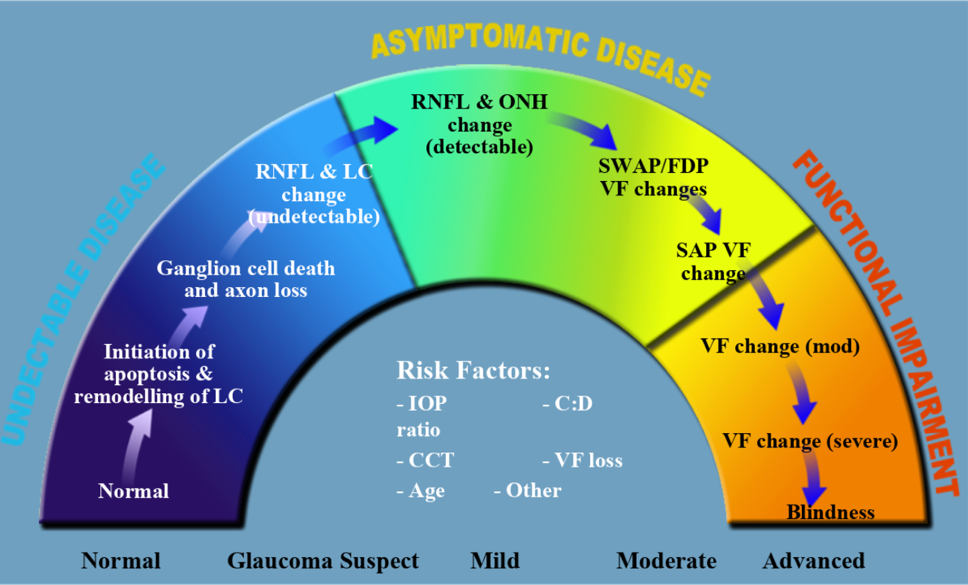
Figure 1. The Glaucoma Continuum, presented in an article by Dr. Weinreb and colleagues in the American Journal of Ophthalmology (Vol 138, Issue 3, Sept. 2004), shows the progression of glaucoma from undetectable to asymptomatic to functional impairment.
Floor effect and tipping point
As the patient reaches the moderate to severe stages of glaucoma, they would have likely lost a significant amount of average RNFL thickness, leading to a “floor effect” on the OCT scan. Within the RNFL, the nerve fiber layers damaged from glaucoma comprise about 60% of the overall structure, while the remaining 40% include glial and other structural tissue that often remains.4
The average RNFL thickness will never reach zero, but rather halts to roughly 55-60um which is known as the floor effect. Structural changes on RNFL OCT scans will no longer be detectable on future imaging after this point.
As our patient transitions into the moderate stage of glaucoma, when should we expect visual field loss to develop? An article by Wollstein et al. performed a cross-sectional study5 to determine the average RNFL thickness at which VF damage becomes detectable and associated with structural loss. They identified a tipping point in which there is a statistically significant steeper decline in VF loss when the average RNFL thickness reaches 75um or less from age-matched normative value.
Substantial structural RNFL loss of 17%, or an average RNFL thickness of roughly 75um, appears to be the tipping point for functional visual field loss to be detectable.5,6

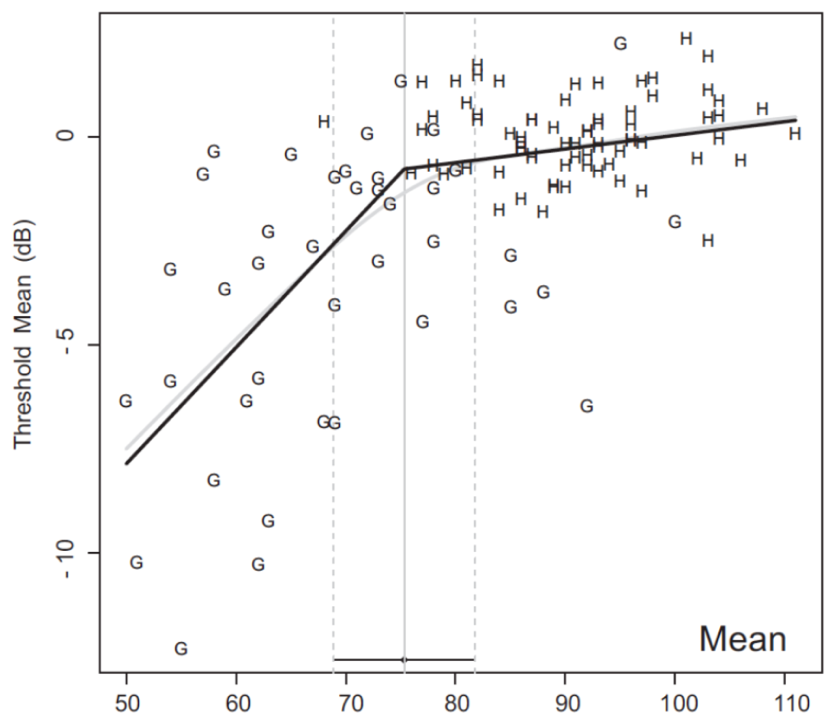
Figure 2. Plot showing healthy (H) and glaucoma (G) average RNFL thickness on the x-axis with corresponding visual field threshold values on the y-axis. The black line demonstrates the “broken stick” model, where the visual field declines at a slower rate with thicker average RNFL values. The tipping point is reached at 75um RNFL thickness where the visual field declines at a steeper rate.
Patient case: Demonstrating floor effect and tipping point
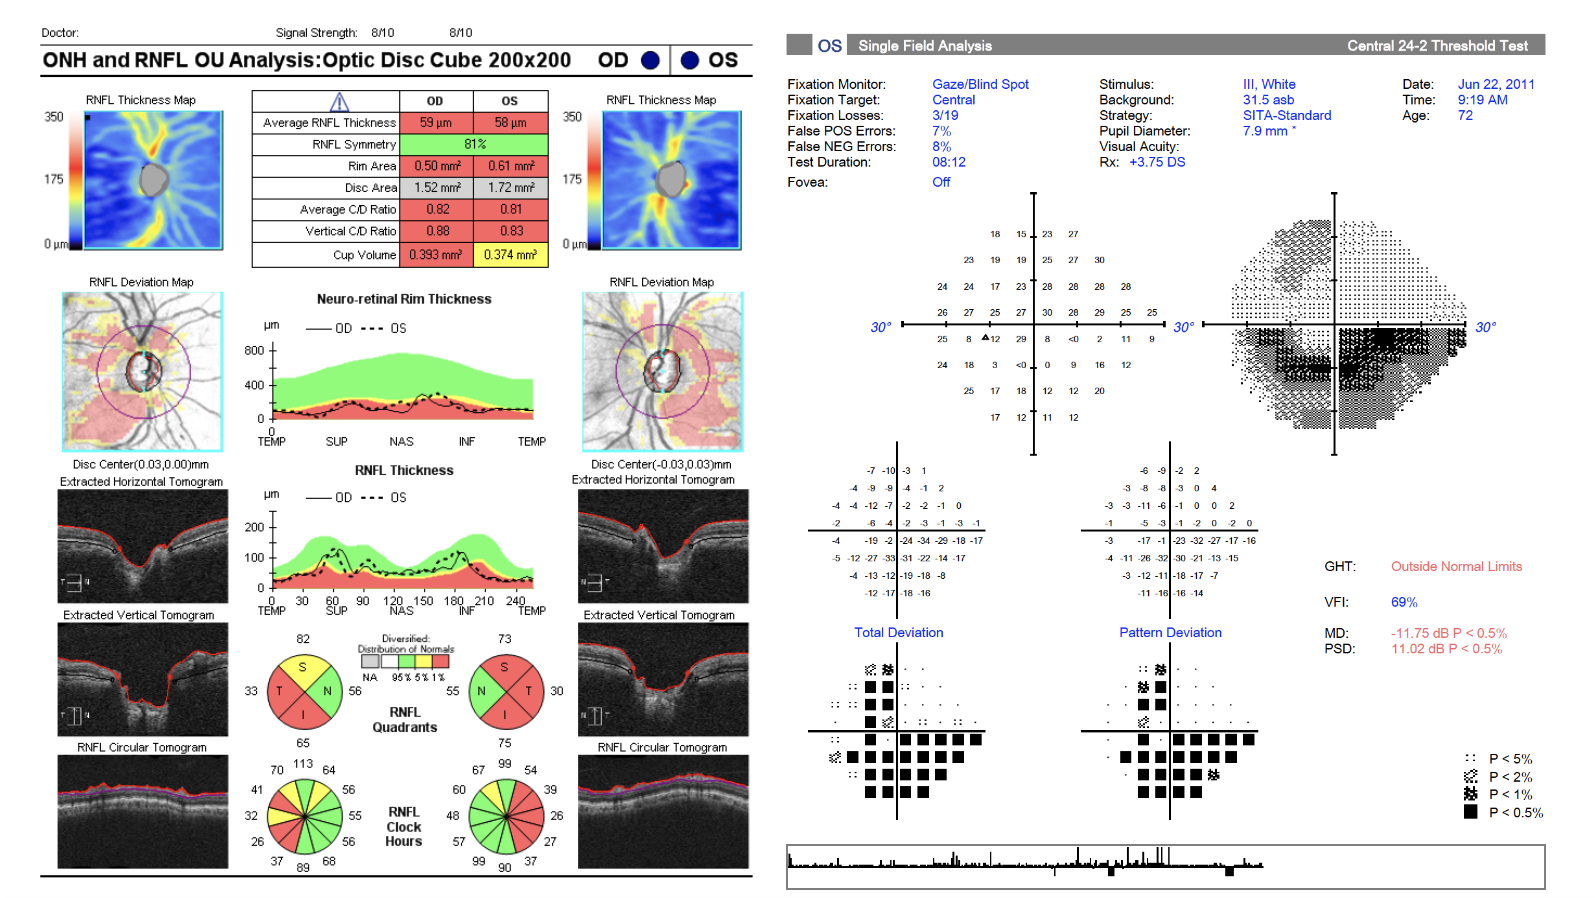
Here is an example of a patient with significant RNFL loss on an OCT scan in 2011. Focusing on the left eye, the average RNFL thickness falls below 60um and there are correlating VF defects on the 24-2.

As we monitor glaucomatous changes overtime between 2011 and 2016, notice that the average RNFL thickness in each quadrant plateaued as it reached the “floor effect”. We would not expect the RNFL thickness to decline any further, however, the patient’s visual field loss continued to decline significantly based on the 24-2 results.

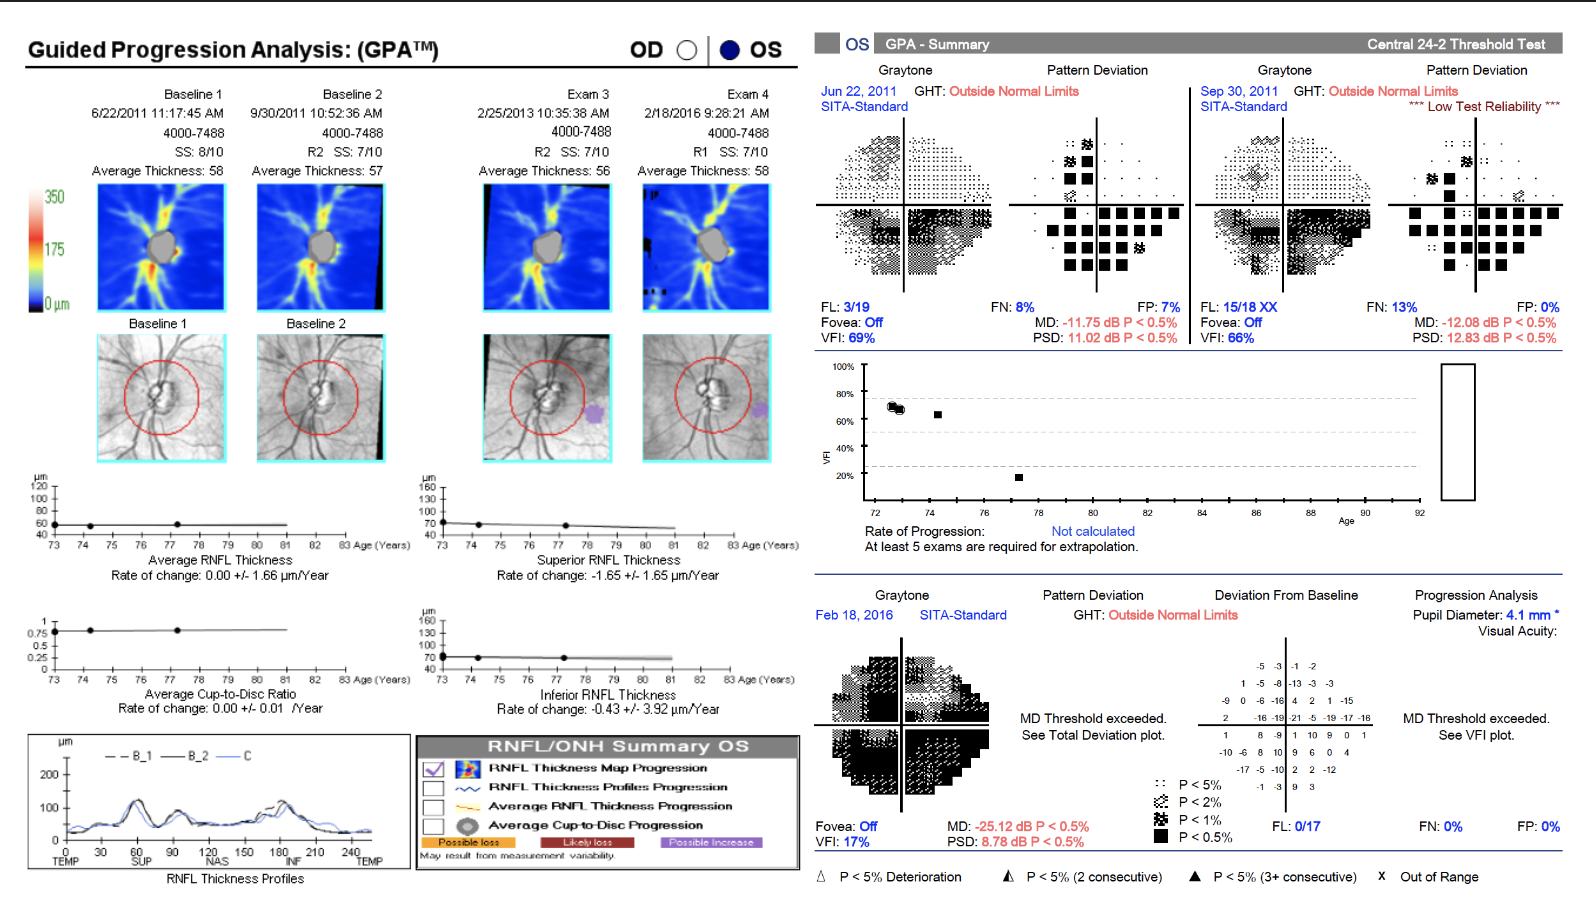
This case is a great example of why monitoring for VF overtime is crucial once the average RNFL thickness has reached the floor effect.
Monitor with Guided Progression Analysis (GPA)
Video: Monitor with Guided Progression Analysis (GPA)
Introduction to Guided Progression Analysis (GPA)
Guided Progression Analysis (GPA) software with HD-OCT and HFA3 tools help monitor glaucomatous changes over time.
Make sure to eliminate any bad quality scans with artifacts from the data to give you the most accurate and reliable information on GPA.
One measure of progression from the GPA report is the trend analysis (figure 3). This regression line determines the rate of change for all of the data collected over time. It is often shown as a slope with a percentage rate of change per year. The benefits of trend analysis include:
- Identifying fast progressors
- Identifying generalized, large areas of structural or functional loss
Another measure of progression from the GPA report is the event analysis (figure 3). This evaluates change compared to the baseline on a point-by-point basis over consecutive tests. The benefits of event analysis include:
- Identifying slow progressors
- Identifying focal areas of structural or functional loss

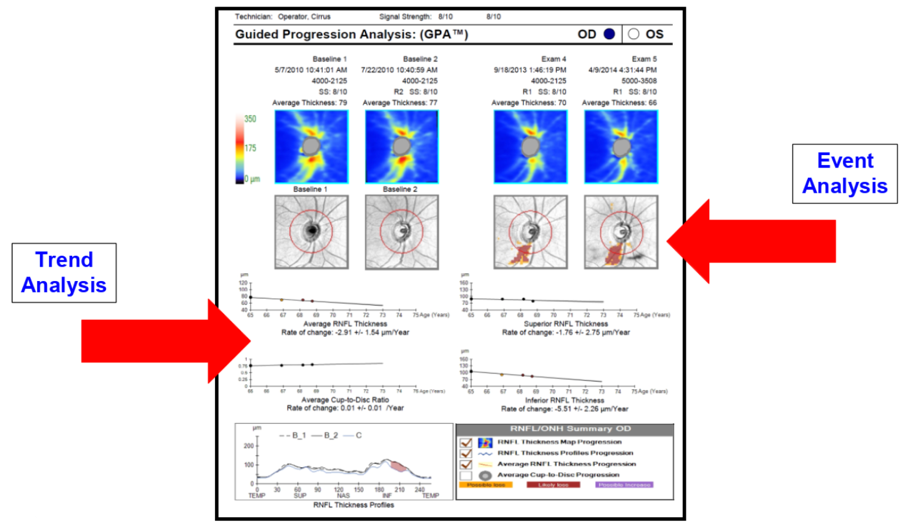
Figure 3. Trend analysis and event analysis in RNFL GPA.
Always pay attention to both the trend and event analysis together because one may not show as much glaucomatous change compared to the other.
Interpreting RNFL and GCL GPA
RNFL and GCL GPAs require two baseline scans before they can begin to interpret changes over time. The trend analysis measures overall rate of change per year by plotting a regression line for the following parameters:
- Average RNFL or GCL+IPL thickness
- Superior RNFL or GCL+IPL thickness
- Inferior RNFL or GCL+IPL thickness
- Average C/D ratio for RNFL scan
The slope for each plot will continue beyond the present data to provide you with an estimate of expected RNFL or GCL loss during the next four or five years if the patient continues the current treatment plan to slow down progression.
Keep in mind that age-related average RNFL loss naturally occurs at a rate of -0.52um per year, and -1.35um to -1.25um per year in superior and inferior quadrants, respectively.7,8 The age-related decline in macular GCL+IPL thickness is -0.32um per year. In a glaucomatous patient, significant change is usually two to three times greater.
The event analysis (figure 3) is a color map that highlights focal areas of significant change within the RNFL or GCL compared to baseline and consecutive tests. Yellow codes for any change that is greater than the test-retest variability, basically saying there is possible loss. Red codes for confirmed changes on a follow-up scan where there likely has been loss over time. Be careful with the event analysis as artifacts can appear red as well. Pay more attention to focal areas of damage in certain quadrants that commonly occur in glaucomatous disease.
Lastly, the RNFL GPA provides a TSNIT progression graph on the lower left corner (figure 3). This graph monitors for significant changes in any given quadrant and highlights progression in:
- Yellow for changes first identified when comparing to both baseline scans
- Red for confirmed changes identified over three or four consecutive scans
Figure 3 (duplicated). The RNFL GPA report for the right eye. Two baseline tests are shown on the top left, and the two most recent tests are shown on the top right. The thickness maps with focal shaded areas of yellow and red are developed by the event analysis. The four plots in the middle are developed by the trend analysis. The TSNIT progression graph is in the lower-left corner.

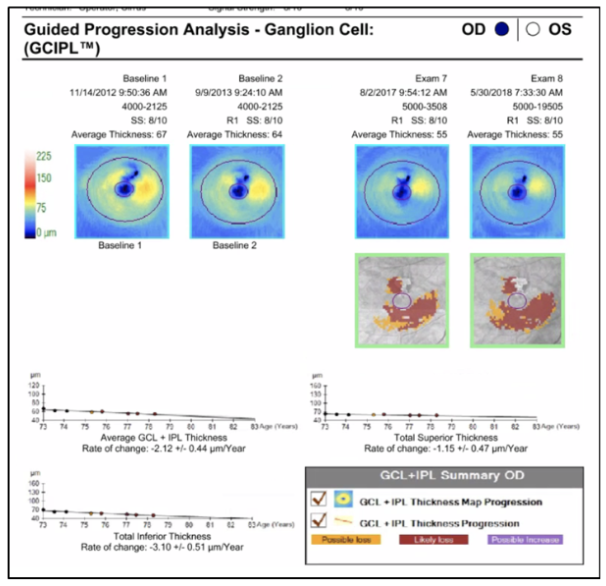
Figure 4. The GCL GPA report for the right eye. Two baseline tests are shown on the left, and the two most recent tests are on the right. This report has a similar structure to the RNFL GPA.
Interpreting HFA GPA
HFA GPA requires two baseline scans before it can begin to interpret changes over time. The trend analysis measures the overall percentage rate of change per year by plotting a regression line for the Visual Field Index (VFI). The VFI percentage is calculated by the HFA to quantify the patient’s visual function, or quality of vision.9 Clinicians often strive to keep the patient’s VFI above 50-60% in order to preserve functional vision.
When looking at the mean deviation plot for each visual field, a slow rate of progression is considered less than 0.5 dB/year, while a very fast rate of progression is considered 1.5 dB/year or higher.10 However, even slower rates in younger patients are still at risk of progressive field loss due to longer life expectancy with glaucoma.
On the HFA GPA, rates of progression that put patients at higher risk of visual disability are often greater than 1.5% VFI per year on the trend analysis.
The slope for the trend analysis also gives a prediction of future progression over the next five years if the patient continues the current treatment plan to slow down progression.
The event analysis uses triangular points to highlight focal areas of significant change within the visual field compared to baseline and consecutive tests. The half-shaded triangles appear in locations that show significant deterioration over two consecutive tests, while the full-shaded triangles appear over three or more consecutive tests. Again, pay attention to any field tests that may have artifacts, as these may show on the event analysis. Focus on areas of the field that are typically affected by glaucomatous damage to look for change.

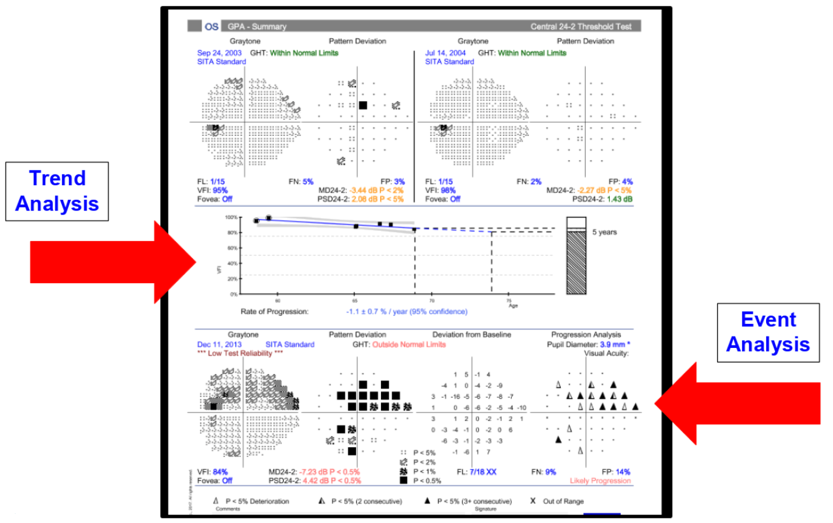
Figure 5. The HFA GPA report for the left eye. The first two baseline tests are shown at the top, and the most recent test is shown at the bottom. The VFI plot in the middle is developed by the trend analysis. The event analysis is in the lower right corner.
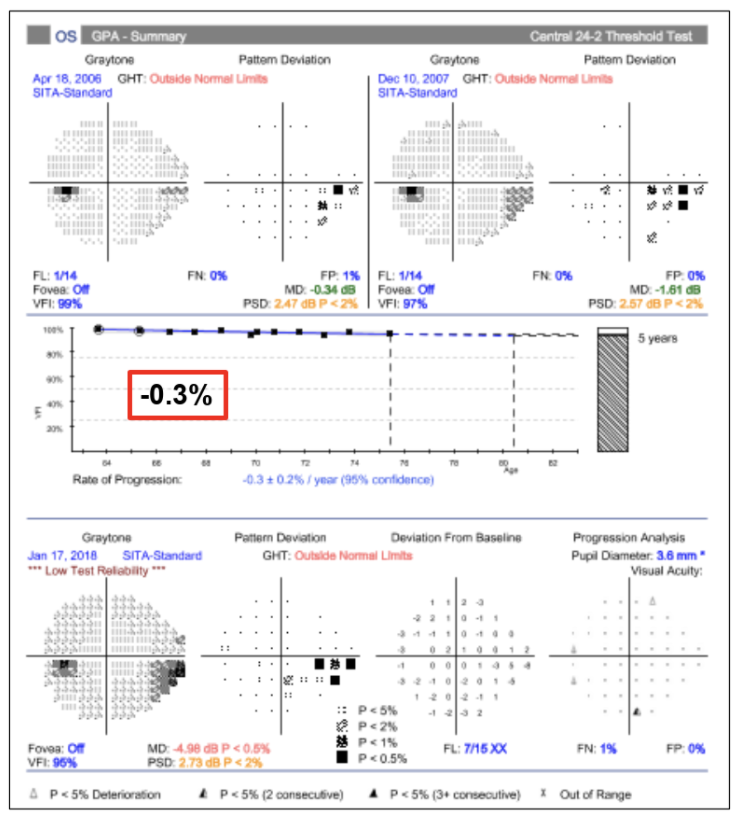
Cases demonstrating the importance of the HFA GPA summary report
Patient #1 has two baseline VF tests in 2006 and 2007. The most recent test was performed in 2018. The trend analysis shows a slow and stable rate of VF progression at -0.3% overtime. The event analysis plot on the bottom right does not show any progression within the area of the local inferior nasal VF defect. Over a span of 12 years, this patient shows a stable local defect and can likely continue their current treatment plan.

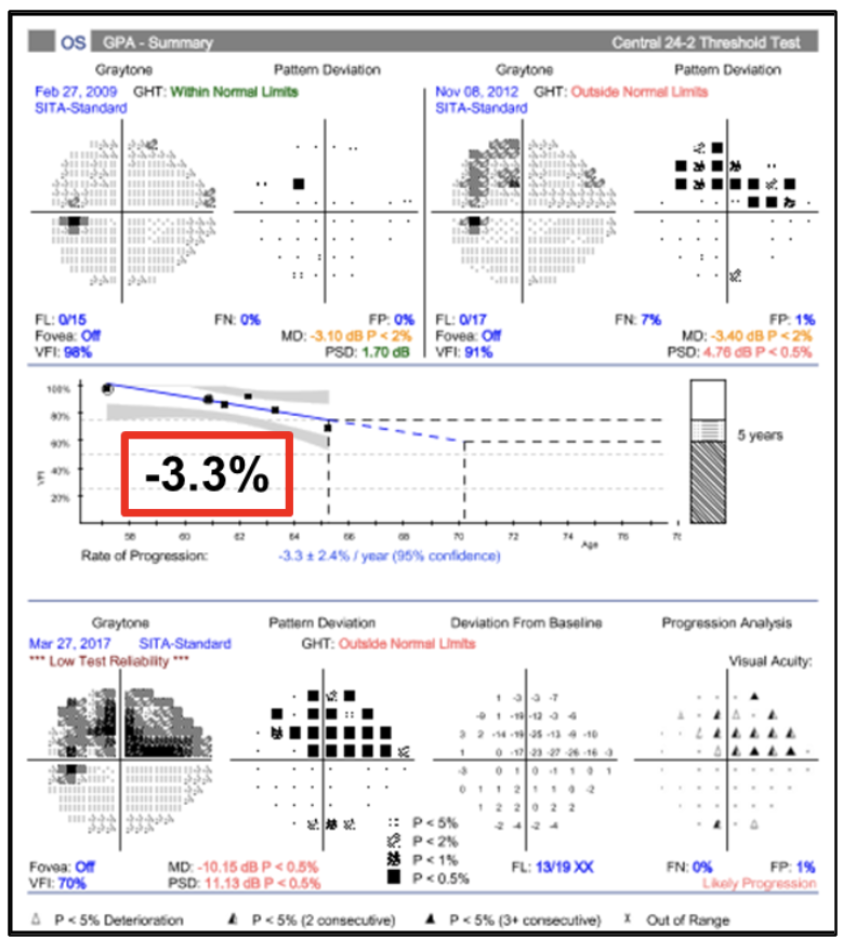
Patient #2 has two baseline VF tests in 2009 and 2012. The most recent test was performed in 2017. The trend analysis shows a significant rate of VF progression at -3.3% overtime. The event analysis plot on the bottom right shows progression within the area of the superior nasal arcuate defect. Over a span of eight years, this patient shows a rapidly progressing defect. Visual field loss in this patient is quite worrisome as the progression points are very close to central fixation, and appropriate management must be determined in order to preserve as much vision as possible for the patient to remain functional.

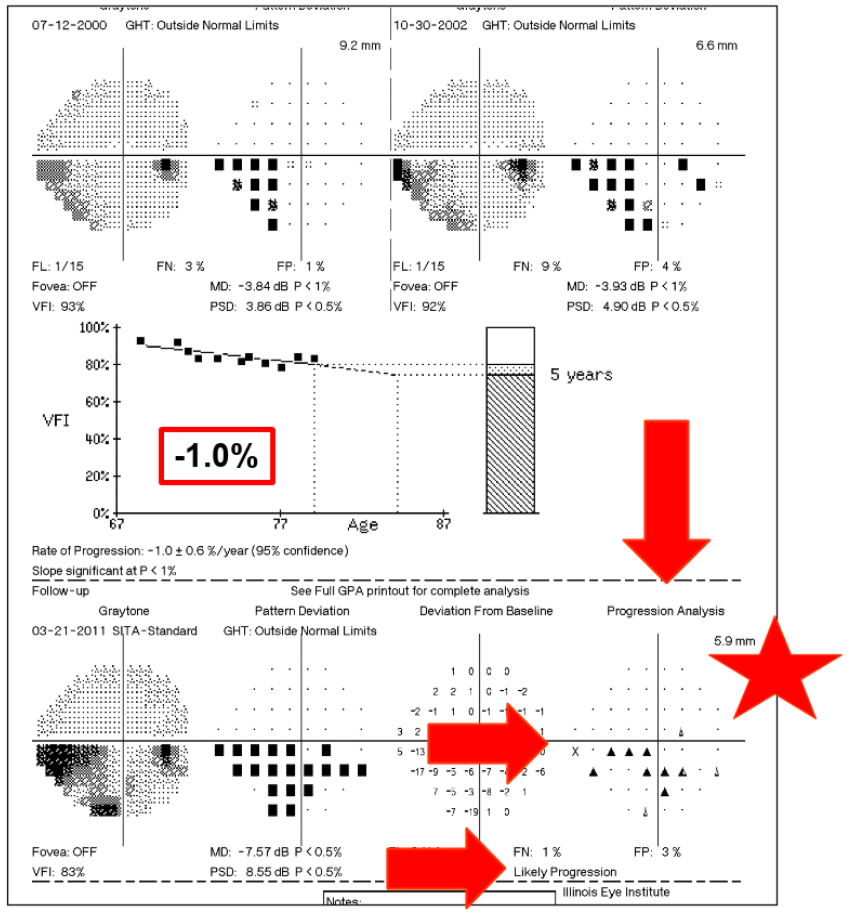
Patient #3 has two baseline VF tests in 2000 and 2002. The most recent test was performed in 2011. The trend analysis shows a marginal rate of VF progression at -1.0% over time, however, pay close attention to the event analysis. There are still local areas of significant progression within the inferior temporal arcuate defect. This goes to show that both trend and event analyses must be evaluated together to identify diffuse or local progression. The management in this patient should be re-evaluated for more aggressive treatment.

HFA3 with SITA-Faster
When we diagnose a patient with glaucoma or as a glaucoma suspect, in addition to discussing the disease itself, we often have a discussion on expectations for visual field testing. As this is a subjective test, it is important for the patient to perform their best to obtain an accurate representation of their quality of vision. The time it takes to complete a visual field varies, however the ultimate conclusion from the patient is that “it takes forever.” So how is it possible to have our patients perform all of this visual field testing for years to come in a timely manner and make them feel good about it?
Implementing SITA-Faster
A multicenter clinical study11 evaluated the comparison and validation of SITA-Faster testing against SITA-Fast and SITA-Standard. SITA-Faster was found to only take about two-thirds of the time required by SITA-Fast, and about half the time required by SITA-Standard. Many patients are able to complete the SITA-Faster 24-2 test in about two minutes! At this time, SITA-Faster is only available for 24-2 field testing.
Clinical testing has also shown that SITA-Faster produces results that are clinically equivalent to SITA-Fast with no loss of repeatability. This means that you can now switch your current glaucoma patients to SITA-Faster and still be able to compare their new results with the previous SITA-Fast results. It can also be incorporated into the HFA GPA report to monitor progression.
Putting the Pieces Together with a Patient Case
BM, a 59-year-old male, was diagnosed with primary open angle glaucoma in 2015. Untreated IOPs were 17/16 mmHg, and pachymetry was 467/475 um. His medical history was significant for hypertension, hypercholesterol, and type 2 diabetes mellitus. He was treated with Lumigan QHS OU and Simbrinza BID OU, which controlled his IOPs to 11/12 mmHg.
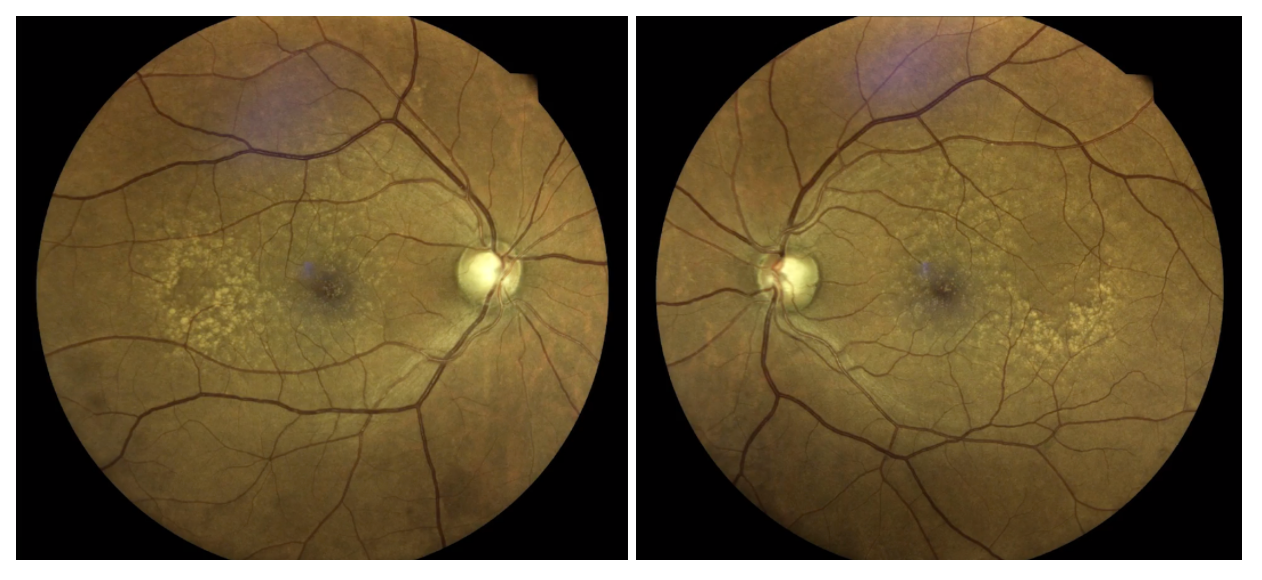
Fundus photography shows large disc size with suspiciously thin rim tissue for each optic nerve head.

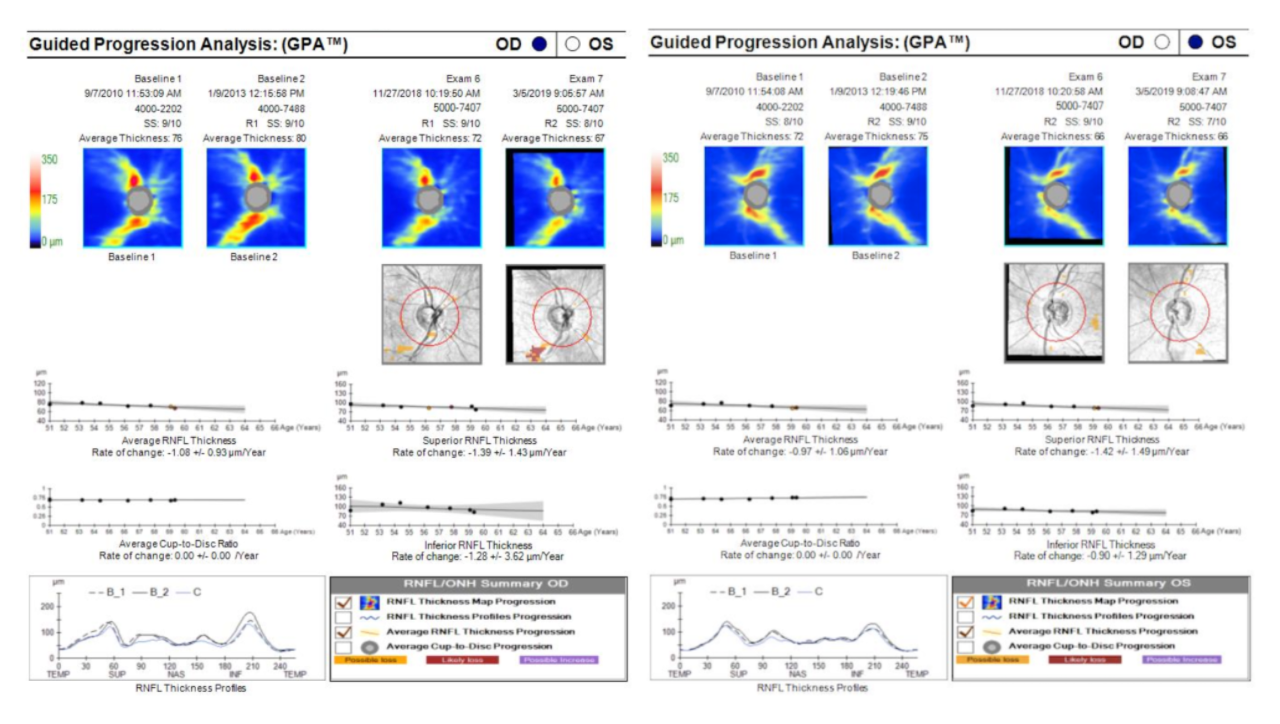
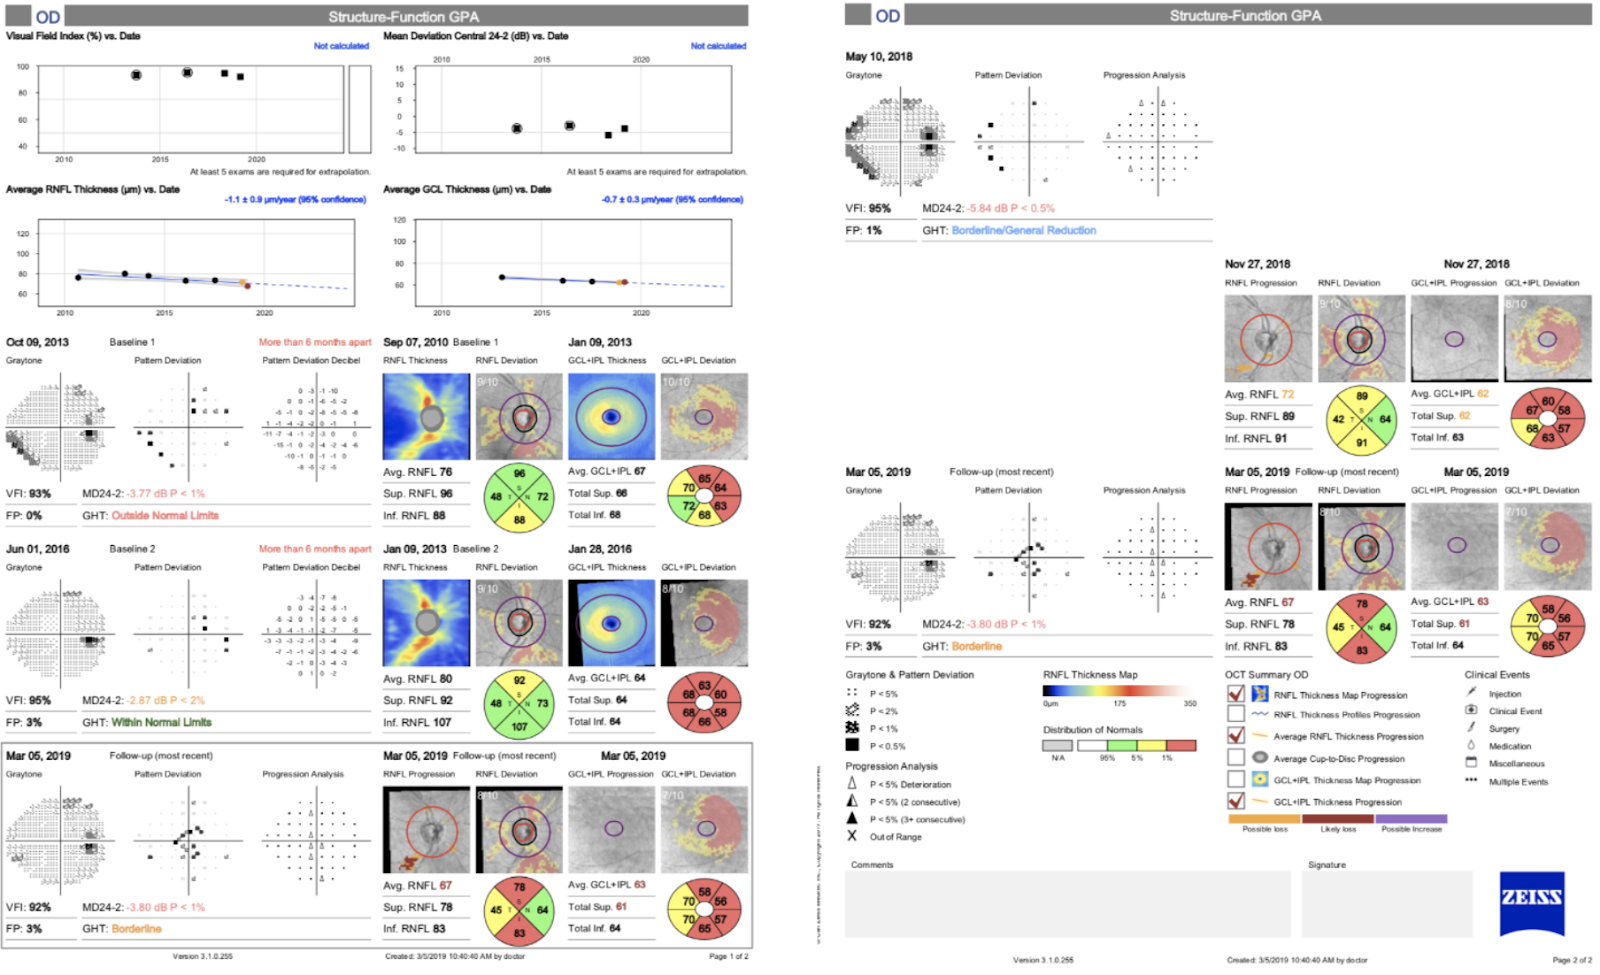
BM was monitored for glaucomatous changes between 2010 to 2019. When looking at the RNFL GPA over a period of nine years, the average RNFL thickness shows 9um and 6um of change in the right and left eye, respectively. The average RNFL trend analysis in the right eye shows roughly 1um of change per year with correlating change in the event analysis within the inferior quadrant. This suggests progressive change that warrants closer monitoring. The left eye trend and event analyses are changing at a slower rate when compared to the right eye, but still suggesting progression as the slope is declining in most quadrants.

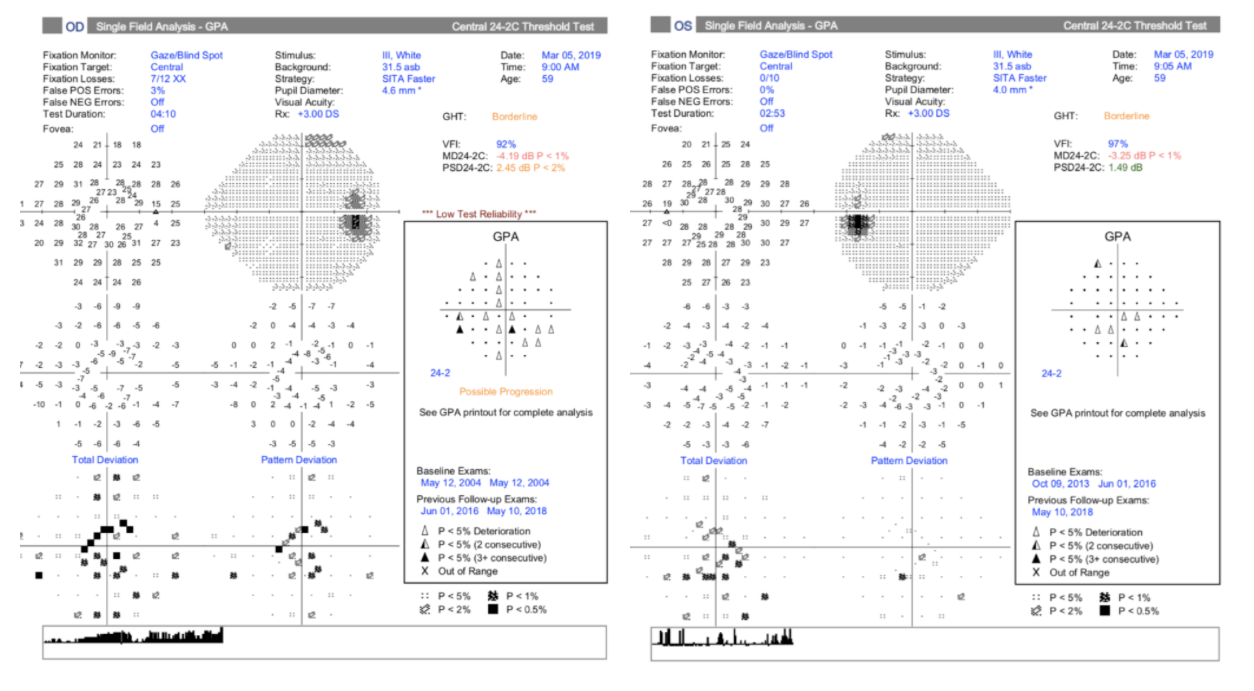
The HFA GPA report for each eye shows the most recent test in 2019 and provides an event analysis on the right side, compared to baseline tests in 2010. Both eyes demonstrate focal areas of progression over time, more so in the right eye than the left. These suspicions for progression also correlate with our RNFL GPA report.

When managing glaucoma, it is key to put both OCT and VF elements together to compare data and confirm areas of progression. ZEISS FORUM Viewer and FORUM Glaucoma Workplace are two software analysis programs that help to collect all the data and provide a robust, dynamic analytical approach to identifying what’s changing in our patient.
The following report combines the OCT RNFL, OCT GCC, and VF tests together in one place to readily identify changes. Both eyes appear to be showing a downward slope in the trend analysis for OCT RNFL and OCT GCC, and progression of focal central points in BM’s visual field.

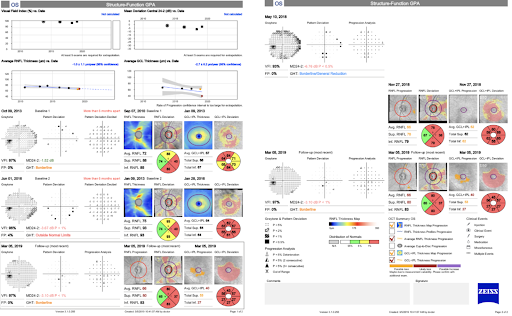
Based on the data shown throughout this case, it was determined that BM was showing possible glaucomatous progression in both eyes, and treatment was altered to become more aggressive.
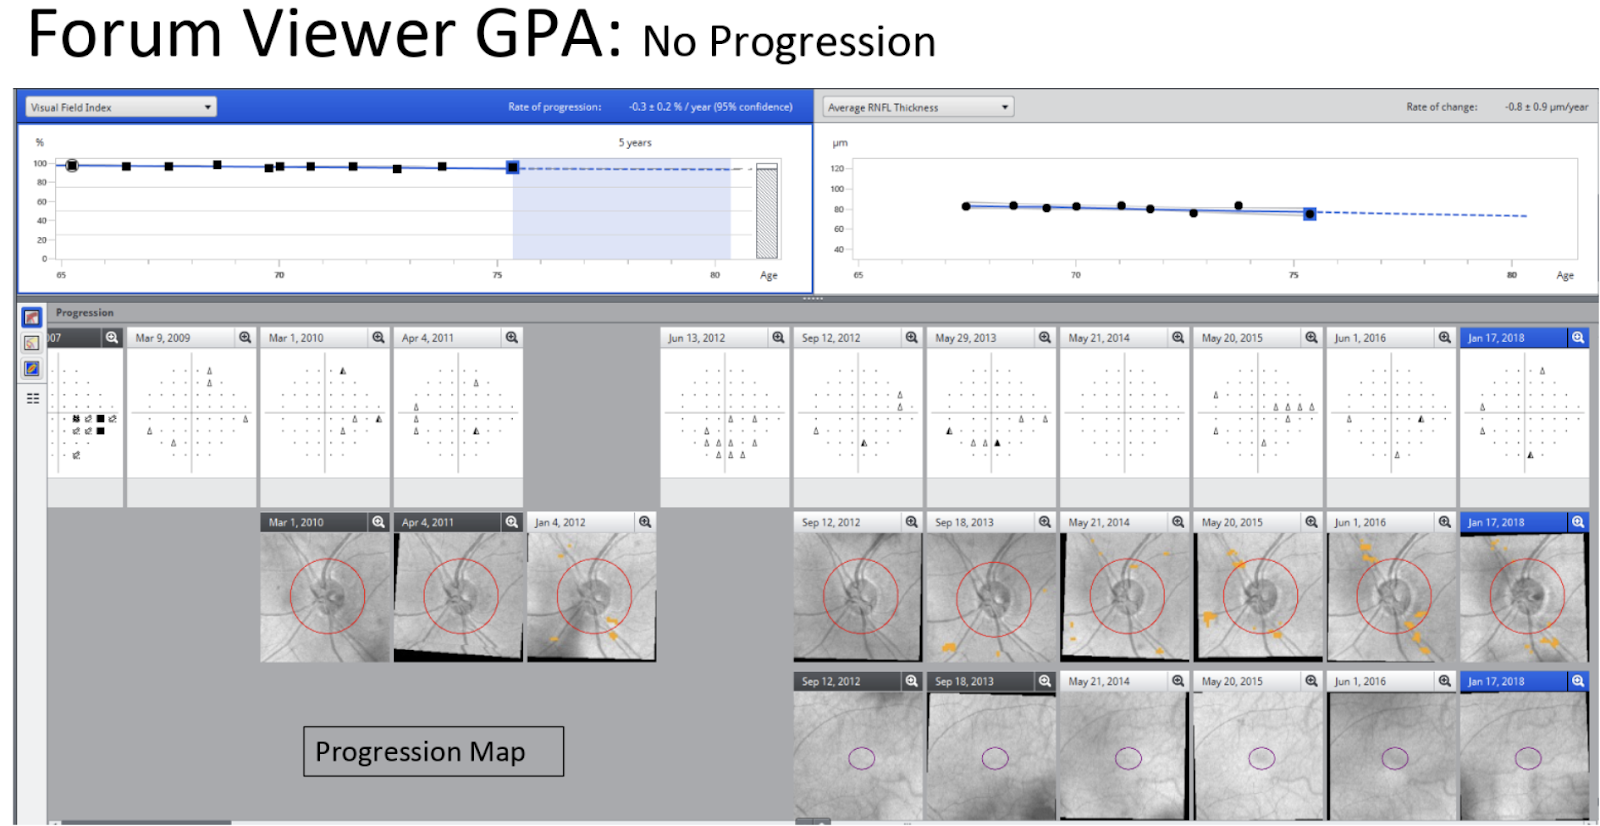
FORUM Viewer and Glaucoma Workplace software can present simultaneous information in different ways. Here is a final example of OCT and VF information combined in a different patient, demonstrating no progression in the left eye’s visual field over an 11-year period. The information shown includes the VF and RNFL trend analyses, and a series of VF tests, OCT RNFL and OCT GCC tests. Presenting information together in this way provides more efficient clinical decision-making on the course of treatment for glaucoma patients.

Conclusion
Disease stage matters when it comes to monitoring for progression in glaucoma patients. As structural change precedes functional change, it is best to consider using RNFL and GCL OCT to monitor progression at baseline in the earlier stage. If the patient is diagnosed with moderate to severe glaucoma at baseline, it is best to monitor progression with HFA. Use the GPA reports to detect overall and focal areas of change over time, and to help guide your clinical decision making in the treatment plan. The GPA reports are also great discussion tools for patients as you can show them the trend and event analyses, as well as the predicted progression rate in the future.
References
- Friedman DS, Wilson R, Liebmann JM, Fechtner RD, et al. An evidence-based assessment of risk factors for the progression of ocular hypertension and glaucoma. Am J Ophthalmol. 2004;138:S19-S31.
- Weinreb RN, Friedman DS, Fechtner RD, Cioffi GA, et al. Risk assessment in the management of patients with ocular hypertension. Am J Ophthalmol. 2004;138(3):458-467.
- Hammel N, Belghith A, Weinreb RN, Medeiros FA, et al. Comparing the rates of retinal nerve fiber layer and ganglion cell-inner plexiform layer loss in healthy eyes and in glaucoma eyes. Am J Ophthalmol. 2017;178:38-50.
- Mwanza JC, Kim HY, Budenz DL, Warren JL, et al. Residual and dynamic range of retinal nerve fiber layer thickness in glaucoma: comparison of three OCT platforms. Invest Ophthalmol Vis Sci. 2015;56:6344-6351.
- Wollstein G, Kagemann L, Bilonick RA, Ishikawa H, et al. Retinal nerve fiber layer and visual function loss in glaucoma: the tipping point. Br J Ophthalmol. 2012;96:47-52.
- Kuang TM, Zhang C, Zangwill LM, Weinreb RN, et al. Estimating the lead time gained by optical coherence tomography in detecting glaucoma before development of visual field defects. Ophthalmol. 2015;122(10):2002-2009.
- Leung CKS, Yu M, Weinreb RN, Ye C, et al. Retinal nerve fiber layer imaging with spectral-domain optical coherence tomography; a prospective analysis of age-related loss. Ophthalmol. 2012;119:731-737.
- Leung CK, Ye C, Weinreb RN, et al. Impact of age-related change of retinal nerve fiber layer and macular thickness on evaluation of glaucoma progression. Ophthalmol. 2013;120:2493-2500.
- Rao HL, Senthil S, Choudhari NK, Mandal AK, et al. Behaviour of visual field index in advanced glaucoma. Invest Ophthalmol Vis Sci. 2013;54:307-312.
- Saunders LJ, Medeiros FA, Weinreb RN, & Zangwill LM. What rates of glaucoma progression are clinically significant? Expert Review of Ophthalmology. 2016;11(3):227-234.
- Heijl A, Patella VM, Chong LX, Iwase A, et al. A new SITA perimetric threshold testing algorithm: construction and a multicenter clinical study. Ophthalmol. 2019;198:154-165.

