


WHAT YOU'LL LEARN
Understand what OCT Angiography is
Know the different types of imaging techniques OCT Angiography offers
Understand how OCT Angiography plays a role in vascular disease diagnosis and management
Introduction to OCT Angiography
Video: OCT Angiography: Routine to Extreme Part 1
What is OCT Angiography?
OCT Angiography (OCTA) is a new, non-invasive imaging technology through which microvasculature structures of the retina and choroid are visualized without the need for dye injection. Through advanced software, OCTA provides a snapshot of red blood cell movement at a fixed point in time allowing for a detailed presentation of vascular flow information at a specific vessel location. In general, dark areas on the scan represent no or low blood flow while bright areas indicate the detection of red blood cell movement. OCTA is a useful tool in not only clinically managing patients who have an underlying vascular disorder or are at risk for vascular disorders (such as patients with diabetes, hypertension, or age-related macular degeneration (AMD)) but can provide further information on the pathophysiology of these vascular disorders as well.
How Does OCT Angiography compare to dye-based angiography?
Intravenous fluorescein and indocyanine green angiography are invasive, time-consuming, and expensive methods that evaluate retinal and choroidal pathologies in a two-dimensional format, respectively. OCTA is a faster and safer imaging tool that requires no dye injection and effectively provides imaging for both retinal and choroidal circulations. In OCTA, there is no vessel filling time, no late stage hyper fluorescence, leakage, or pooling that can obscure vasculature, structures, and dimensions.1 Moreover, OCTA provides a three-dimensional high-resolution display that focuses on the fine details of the morphology and activity of superficial retinal microvasculature to the deep capillary structures within the choroid. When considering these advantages, OCTA can be thought of as an additional tool to conventional dye-based angiography in assessing vascular disease regression or progression in clinical practice today.

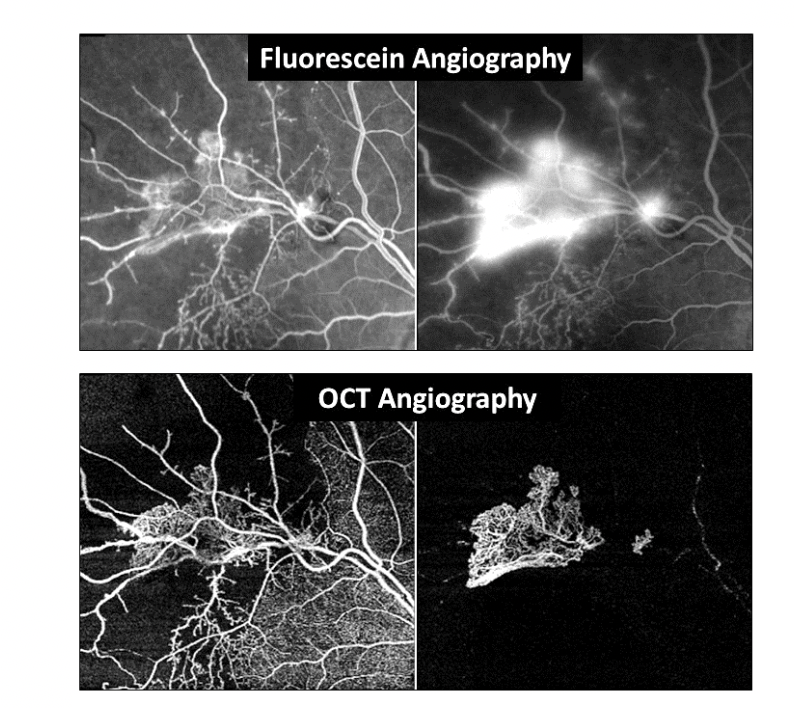
Figure 1: Fluorescein Angiography images show typical vessel leakage while OCTA images show precise delineation and measurement of these same vessels.
OCT Angiography Imaging Techniques
Volumetric data acquisition
Volumetric data acquisition provides sequential scans that tease out layers of the retina from the anterior superficial capillary plexus to the posterior choriocapillaris and choroid. In order to examine a specific retinal layer for pathology, this display provides the ability to highlight certain areas of vasculature and isolates blood flow information at a specific retinal depth which can be used to follow response to treatment.

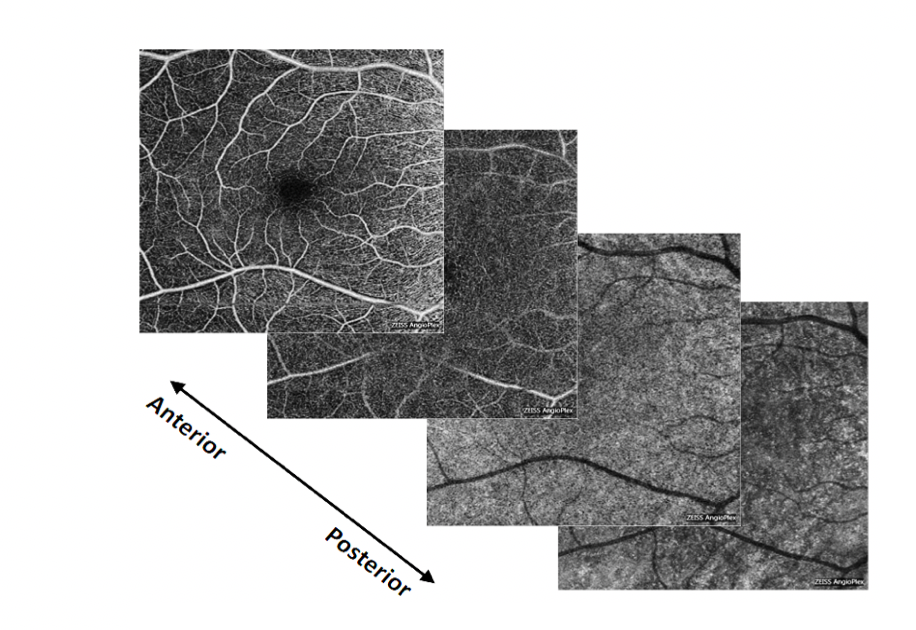
Figure 2: Sequential 6x6mm OCTA maps from the anterior superficial retinal capillaries to the posterior choriocapillaris.
Retinal blood flow analysis
Blood flow analysis within the retina and choroid are created through motion contrast where several B scan images of the same cross-sectional area are taken at once and compared against each other. Once the technology accounts for head movements and saccadic eye movements, the reflectivity patterns imaged are based on red blood cell motion. This gives a superimposed blood flow overlay that is color coded to correlate data with other vasculature and structural images. Motion contrast comes in handy in deciding if vascularization of preretinal tissue and pigment epithelial detachments are present or not.

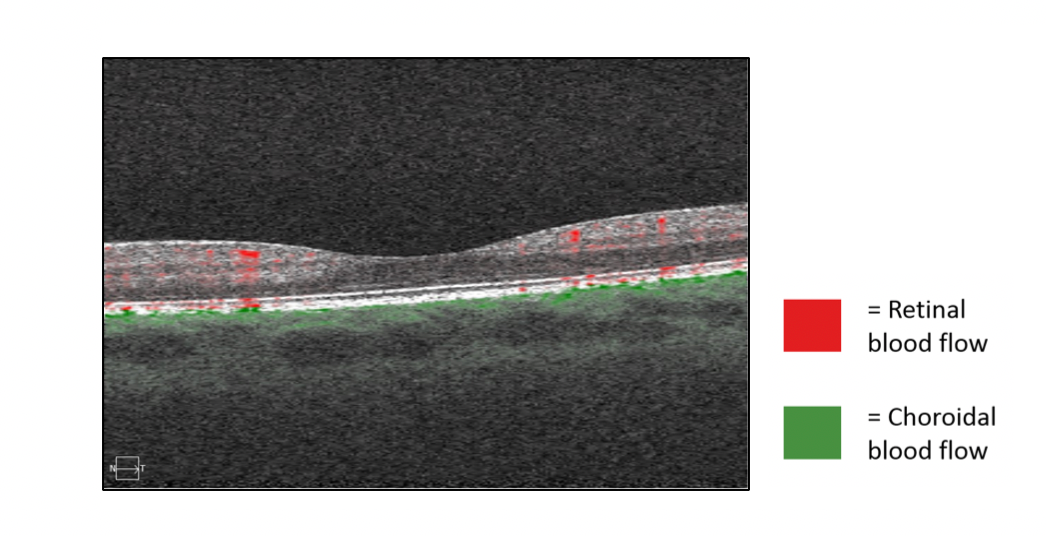
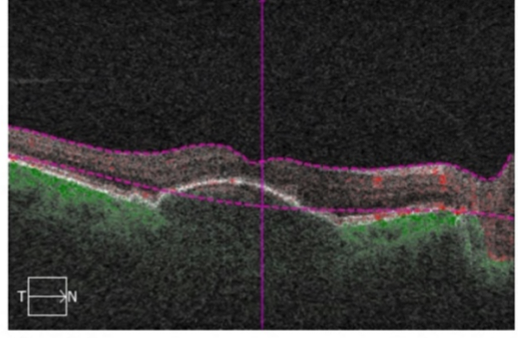
Figure 3: OCTA scans generate cross-sectional structural B scan blood flow images of the macula through motion contrast where red indicates retinal blood flow and green indicates choroidal blood flow.
En-Face display
En-Face display is the most common method for viewing OCTA data. The analysis interface takes several retinal layers and compresses the three-dimensional information into a two-dimensional format. The display highlights anatomical segmented areas of the retina and choroid that correspond with the vasculature representation of the exact area being visualized. This would be useful for detecting abnormal preretinal vessel growth from the central retinal artery and abnormal vessel growth in the choroid extending from the choriocapillaris.

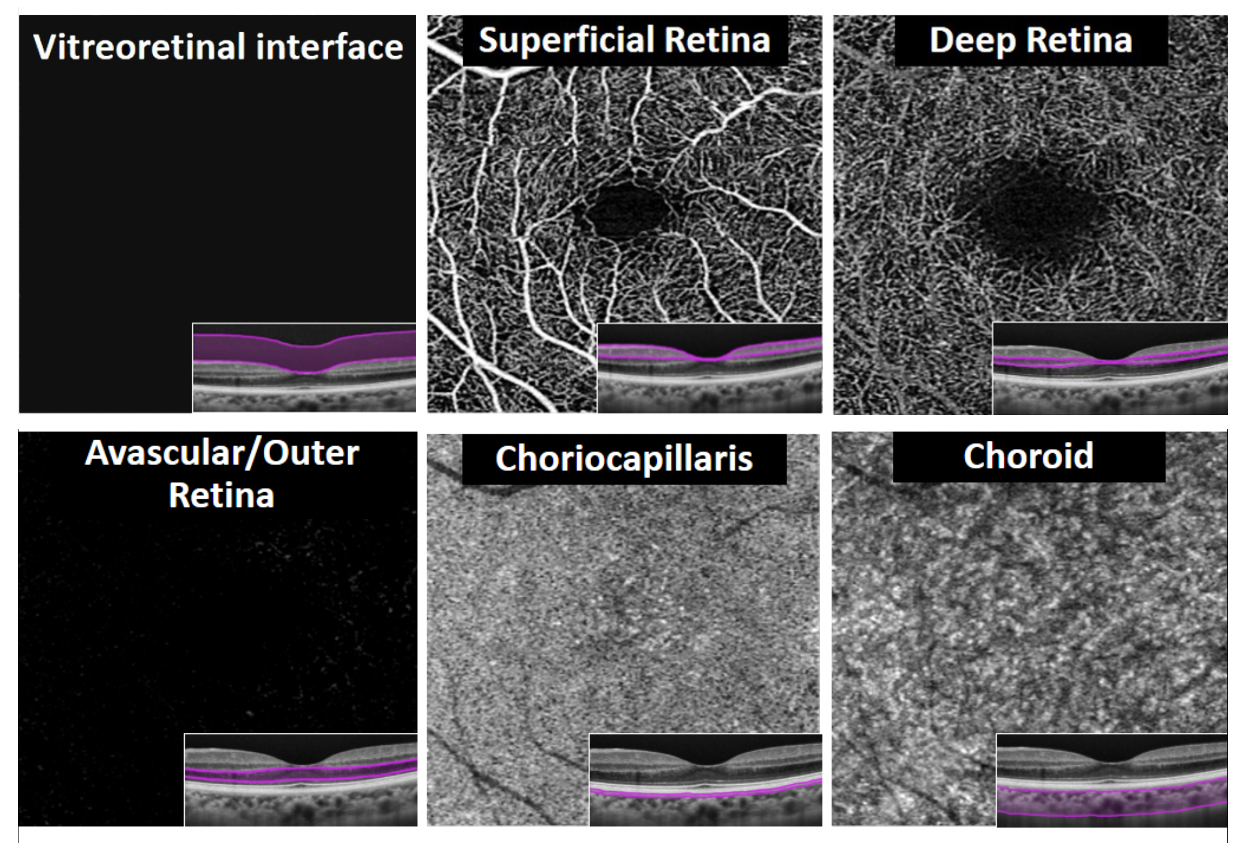
Figure 4: A two-dimensional 6x6mm OCTA map of the microvasculature representation according to different anatomically segmentation profiles outlined in purple.
Widefield OCTA
Widefield OCTA allows for larger areas of retinal vasculature to be imaged where diagnosing peripheral exudative retinal retinopathies like sickle cell retinopathy and carotid artery disease become easier.2 This imaging technique is also useful for managing vascular conditions like diabetic retinopathy and venous occlusive disease since it allows for the detection of nonperfusion in the midperiphery retina in addition to the posterior pole. Gauging how much nonperfusion is present allows for a more accurate classification of ischemic versus non-ischemic retinal areas and assists in predicting how closely patients need to be monitored or if they need to be referred out to a specialist.

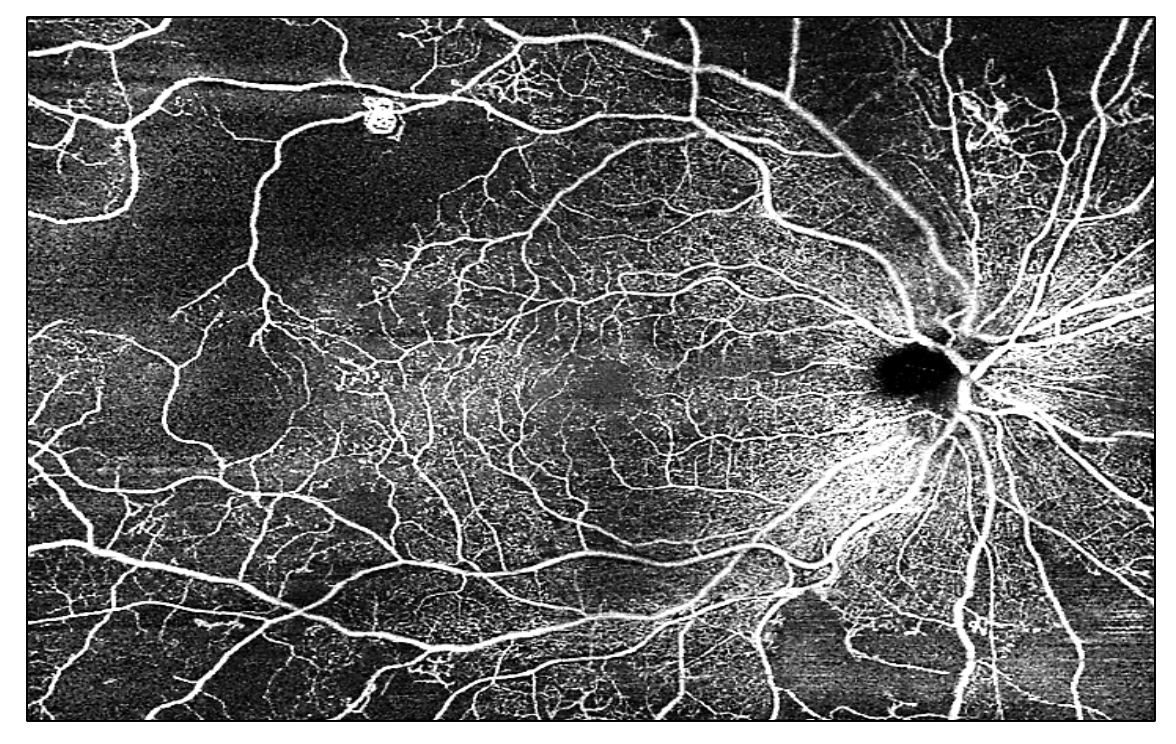
Figure 5: Ultra-widefield OCTA scan of the right eye showing signs of proliferative diabetic retinopathy in the mid-peripheral retina.
Clinical Applications of OCT Angiography
Video: OCT Angiography: Routine to Extreme Part 2
Subclinical detection
OCTA can provide a better understanding of vascular disease processes and pathogenesis through early and more detailed representations of the vascular anatomy and pathology that are normally not detected during a clinical examination. OCTA can lead to subclinical disease detection by highlighting and localizing vascular abnormalities such as microaneurysms, intraretinal microvascular abnormalities (IRMA), telangiectasias, sources of macular edema, and foveal avascular zone enlargement. This information can lead to the diagnosis of old, chronic, and longstanding vascular events, where clinicians may be confused about the etiology of reduced visual acuities, poor visual function or other vascular changes. Subclinical disease detection provides better patient care through more careful follow up schedules, aggressive clinical recommendations, and different patient education plans and referrals.

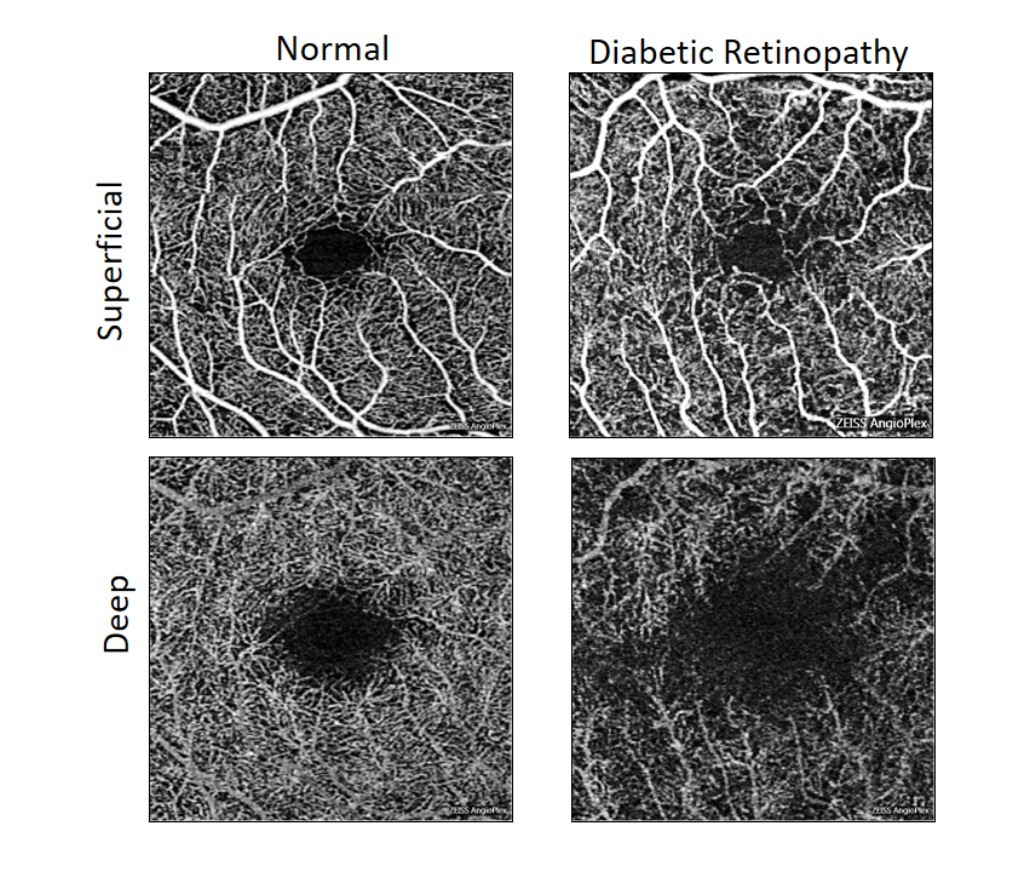
Figure 6: 6x6mm OCTA scans indicating early detection of diabetic retinopathy in a diabetic patient that showed no visible signs of diabetic retinopathy during the clinical examination. The OCTA maps on the right show capillary dropout, microaneurysms, and enlargement of the fovea avascular zone in superficial and deep retinal layers compared to the healthy and normal microvasculature map on the left.

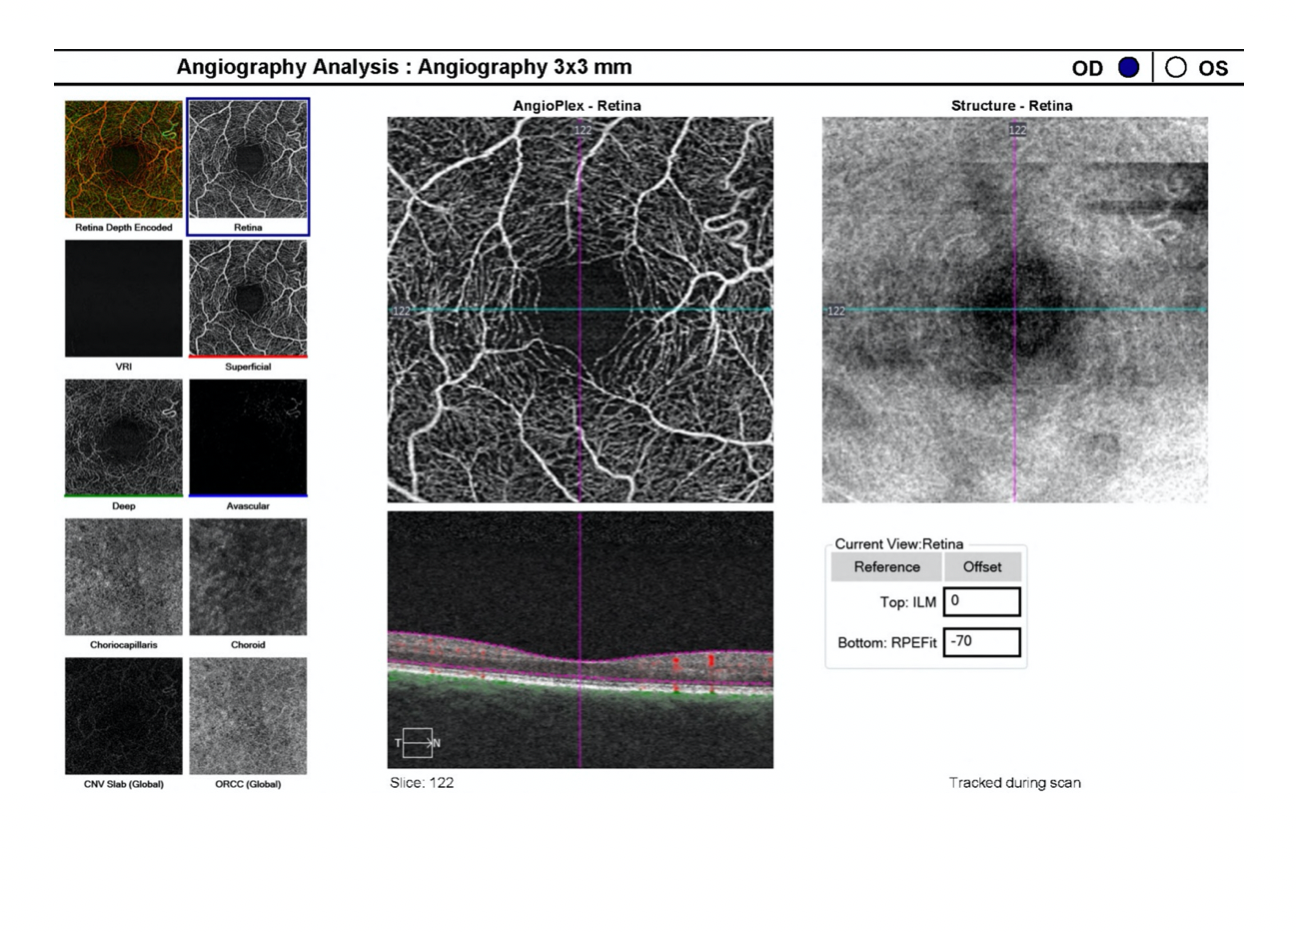
Figure 7: En-Face display showing superficial vasculature disorganization and a small collateral vessel indicated by a red arrow on the AngioPlex-Retina map. The vitreal-retinal interface (VRI) image on the left is completely black and devoid of preretinal vasculature providing evidence that the collateral vessel finding is consistent with an old branch retinal vein occlusion and the patient does not need urgent treatment. The OCTA analysis is able to differentiate collateral vessels from preretinal neovascularization which is an important distinction to make because certain disease diagnoses will affect how the patient is medically managed.

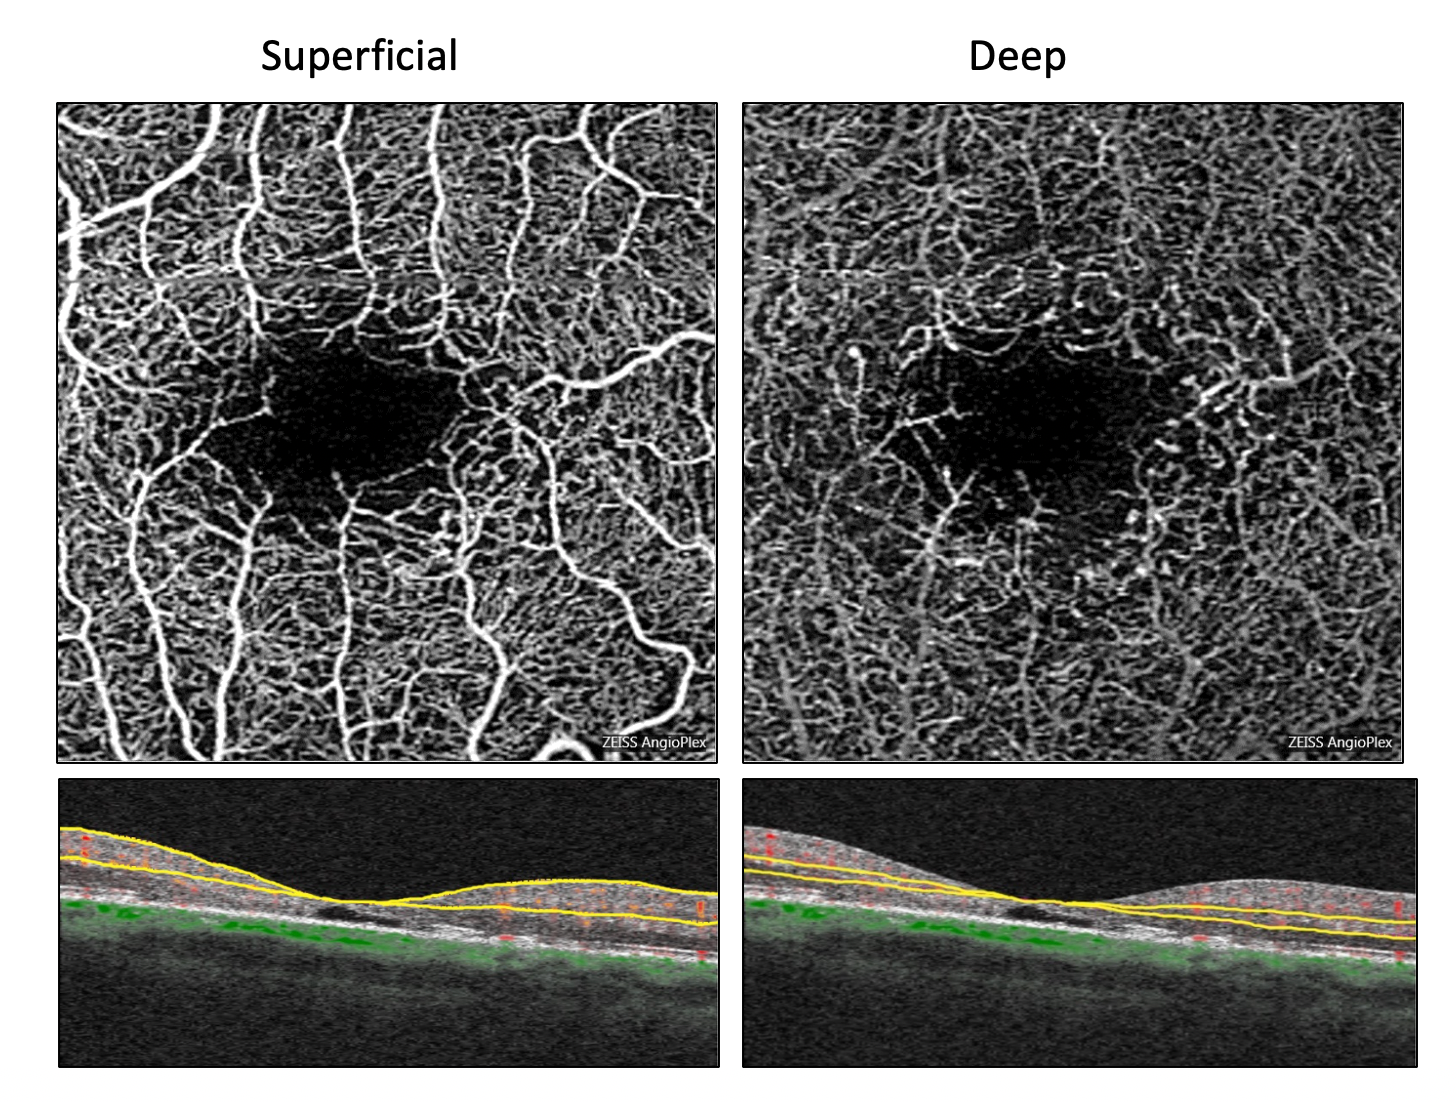
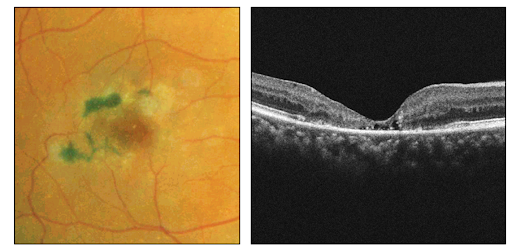
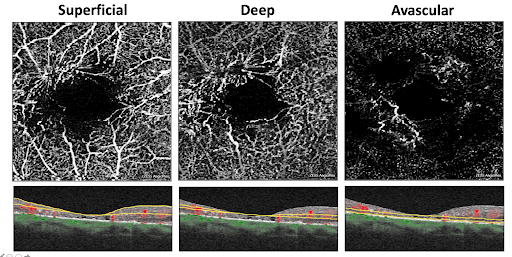
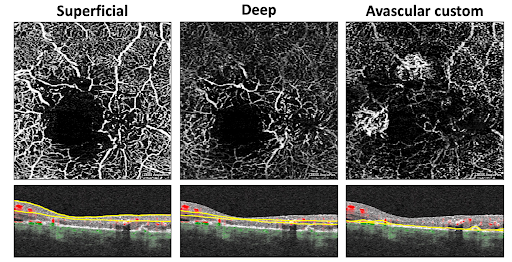
Figure 8: Superficial and deep 6x6mm OCTA retinal microvasculature maps showing incredible subtle vascular changes consistent with telangiectatic type vessels indicating early signs of macular telangiectasia type 2. Telangiectatic type vessels are observed 360 degrees around the foveal avascular zone and likely associated with the atrophy of the outer retina that is visualized with the bottom structural B-scans.
Non-perfusion
Retinal and choroidal non-perfusion cannot be visualized and accurately classified during a clinical examination or with standard fundus photography. Detecting, localizing, and quantifying areas of non-perfusion with OCTA can assist clinicians in deciding how to appropriately treat and manage patients.
Retinal non-perfusion is most commonly seen in diabetic retinopathy and venous occlusion events. OCTA can detect the degree of peripheral non-perfusion in a severe non-proliferative diabetic retinopathy patient where clinicians can then better gauge treatment plans and decide who needs immediate treatment versus who can be monitored. It is important to remember that about 50% of eyes with ischemic branch retinal vein occlusions will develop neovascularization of the disc and elsewhere, of these eyes about 50% will develop a preretinal or vitreous hemorrhage if left untreated.3 OCTA can differentiate between these ischemic and non-ischemic vein occlusions in order to determine the correct follow up patterns, treatment strategies, and prognosis for visual outcome.

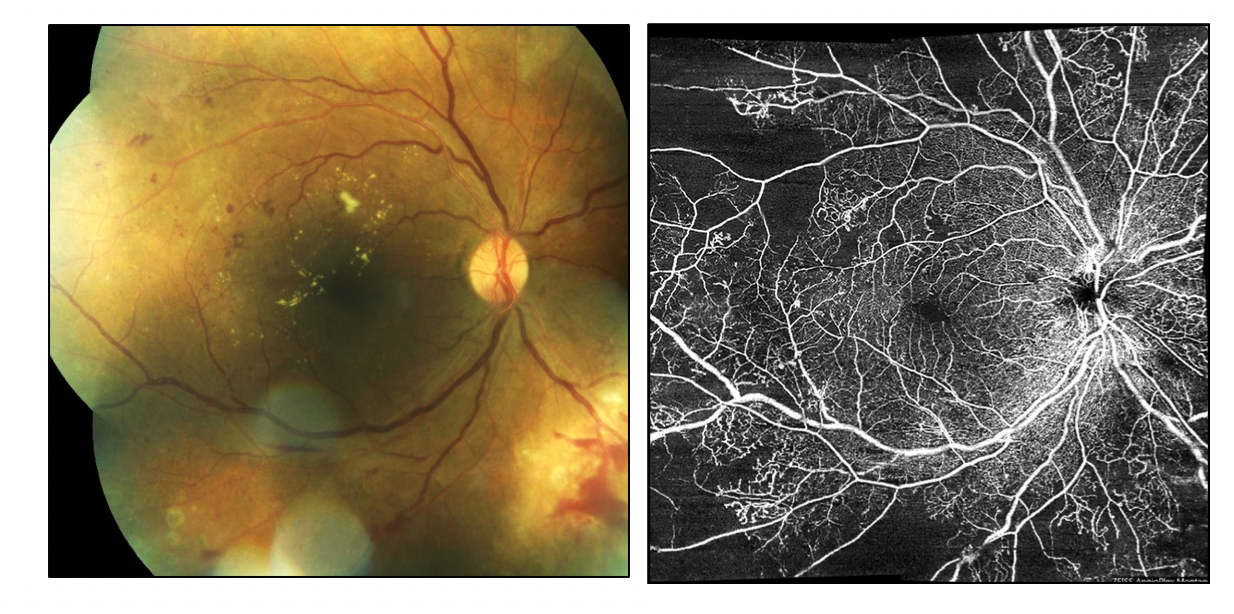
Figure 9: Ultra-widefield fundus photography and OCTA scan of a right eye in a non-proliferative diabetic retinopathic patient. The ultra-widefield OCTA scan on the right detects massive peripheral non-perfusion, enough capillary drop-out, and other risk factors to go ahead and initiate treatment for the prevention of proliferative diabetic retinopathy.

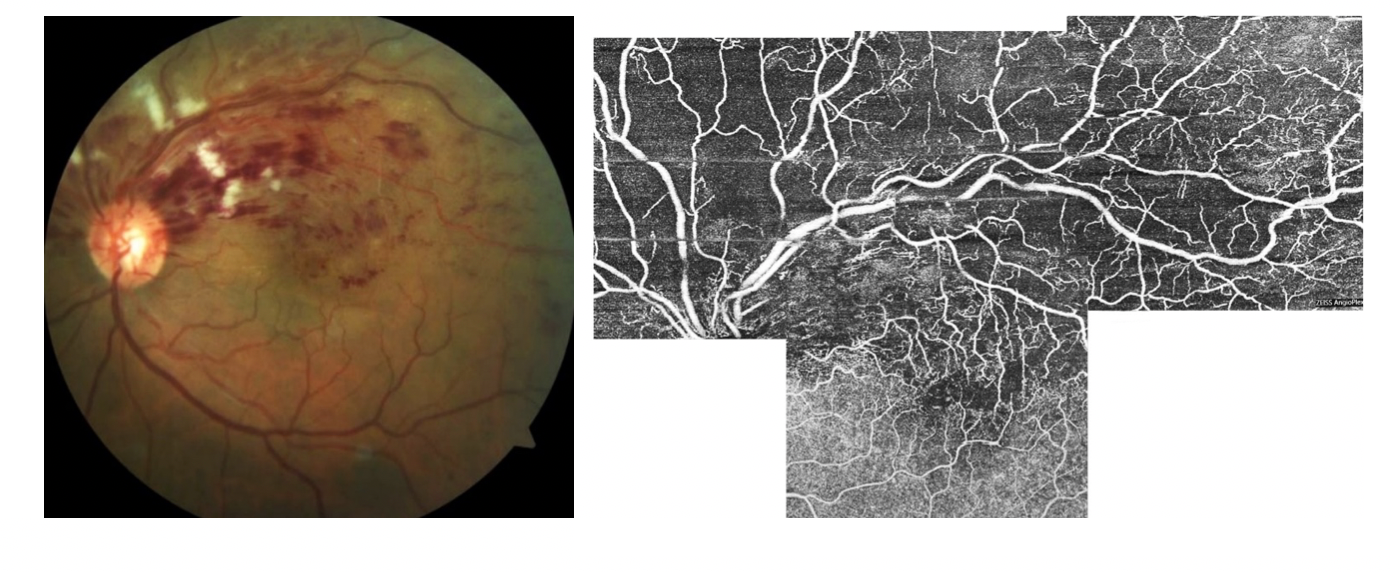
Figure 10: Fundus photography and OCTA scan of a left eye representing a superior branch retinal vein occlusion. The OCTA scan on the right further indicates that the branch retinal vein occlusion is ischemic due to the area of non-perfusion being greater than 5 disc diameters.
Visual acuities and visual function can be reduced due to macular edema or non-perfusion, otherwise known as macular ischemia. OCTA can detect when macular edema is present by comparing the data from the structural and visual scans. In macular ischemia, there is likely to be a change in vasculature including measurable vessel density changes in the superficial and deep capillary plexus, microaneurysms, and areas of non-perfusion.4 These vascular changes can influence the development and prognosis of macular edema overtime.

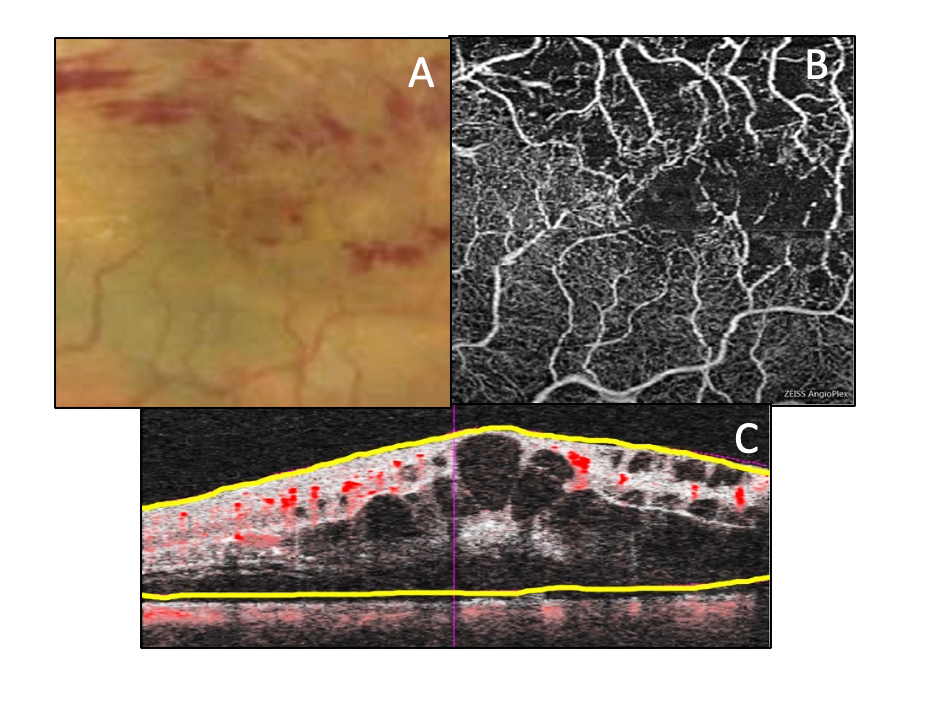
Figure 11: Fundus photography (A), OCTA map of the deep capillary plexus (B), and structural blood flow analysis B scan (C) representing macular ischemia from a branch retinal vein occlusion. Images B and C correlate in detecting lower vessel density, microaneurysms, and non-perfusion in the macular region.
Choroidal non-perfusion affects both retinal and choroidal circulation systems and is most commonly seen in AMD, giant cell arteritis, and ocular ischemic syndrome. In nonexudative AMD, OCTA can detect areas of nonperfusion in the choriocapillaris directly underneath areas of drusen and small drusenoid pigment epithelial detachments4. OCTA can also visualize areas of blood flow impairment within the choriocapillaris that is immediately surrounding geographic atrophic lesions. OCTA will be a great tool in determining the prognosis of geographic atrophy enlargement overtime and can be part of longitudinal studies that examine if choroidal non-perfusion is involved in the pathogenesis of geographic atrophy development and expansion, and whether or not areas of choriocapillaris hypoperfusion can predict where abnormal choroidal vessel growth may develop.

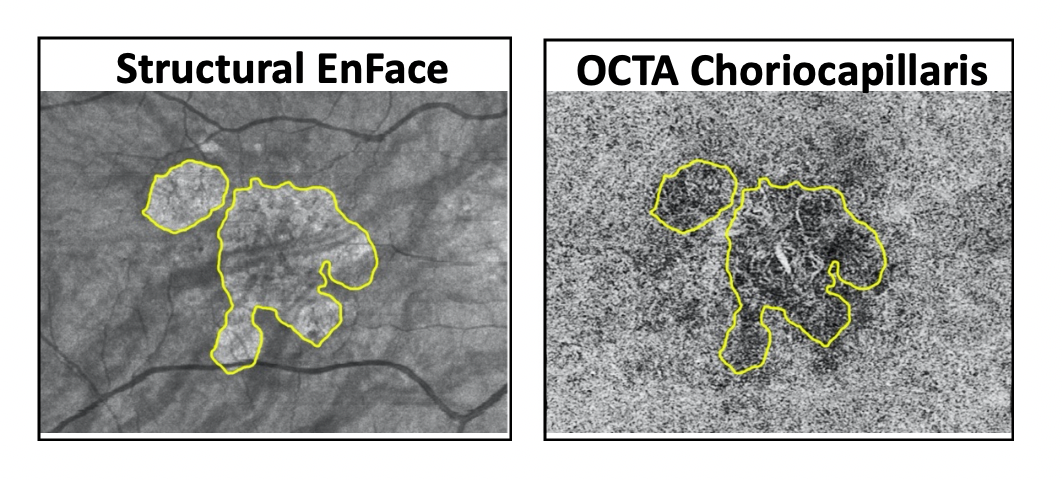
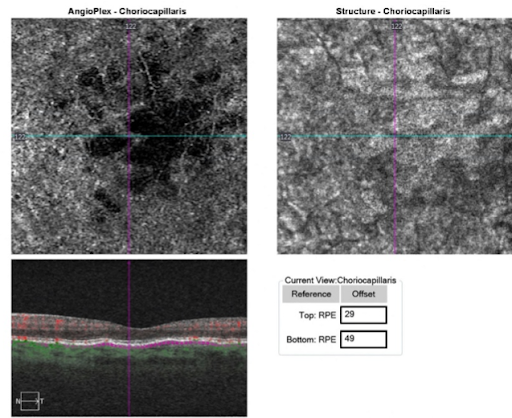
Figure 12: OCTA structural and microvasculature maps of the choriocapillaris indicate impairment of choriocapillaris blood flow that is present immediately surrounding the geographic atrophic zones outlined in yellow.
Optic disc and radial peripapillary capillary plexus non-perfusion are most commonly seen in glaucoma and optic neuropathy. OCTA can differentiate between optic neuropathies and help clinicians properly diagnose these conditions when there may be several differentials. In a healthy optic nerve, the superficial and deep capillary plexus OCTA scans will show a dense, profuse vessel network that is brighter compared to an ischemic optic nerve with pallor that will have a marked decrease in vessel density and loss of perfusion in the superficial and deep scans. In demyelinating disease, like optic neuritis where etiology is more so related to an inflammatory component than a vascular one, less acute vascular density changes that are not as nearly marked or pronounced as seen in vascular optic nerve disease will be observed.6,7,8
In glaucoma, OCTA shows evidence of non-perfusion of the radial peripapillary capillary plexus immediately surrounding the disc and macular region that corresponds well with structural retinal nerve fiber layer loss and stage of disease. Even though OCTA provides evidence of reliable, corroborating data that goes along with the structural OCT and visual field loss data, the relationship is not fully understood. In the future, OCTA may be a potential tool to help diagnose, manage, and understand the pathophysiology of glaucoma.

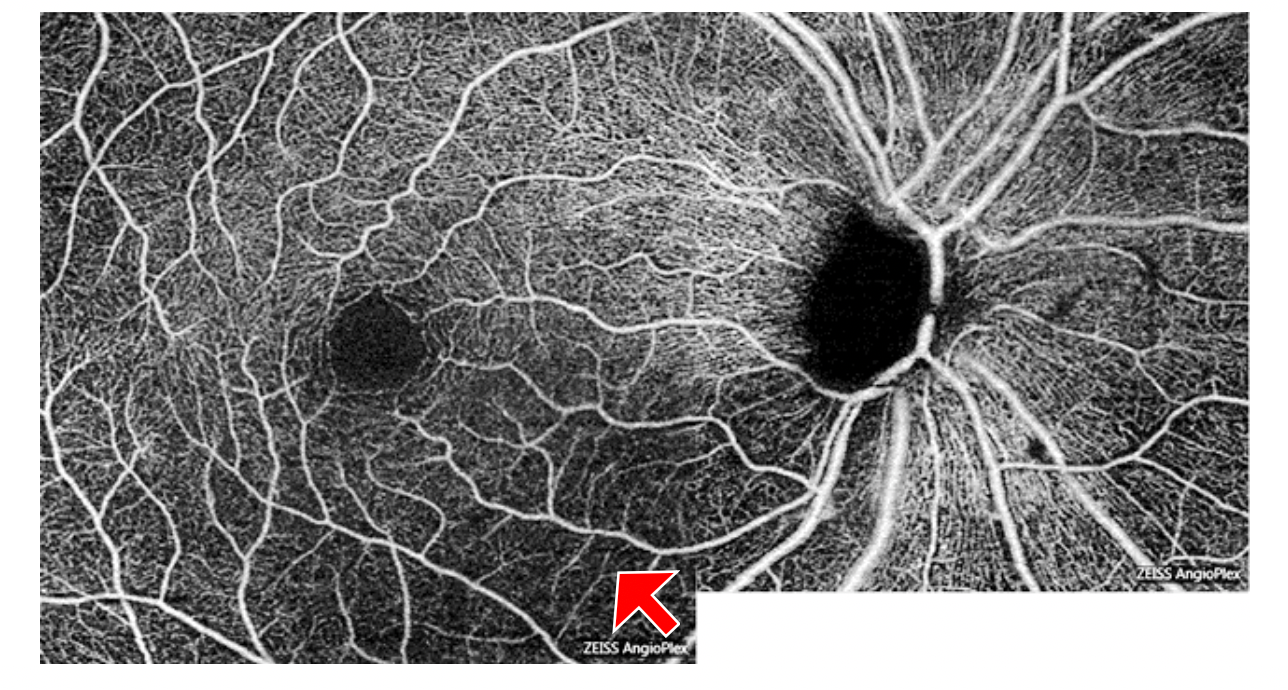
Figure 13: OCTA superficial microvasculature map of a right eye where decreased perfusion of the optic nerve head, peripapillary capillaries, and macular are well evidenced by the red arrow.
Video: OCT Angiography: Routine to Extreme Part 3
Neovascularization
OCTA can detect, localize, and define neovascularization allowing for easy monitoring of disease regression and progression, and determining the level of retreatment needed based on the exudative activity and morphology.
Through superficial vasculature scans and structural B scan overlays, OCTA can highlight specific anatomical locations of preretinal vascular membranes between the borders of perfusion and nonperfusion. This information can better diagnose and detect subtle preretinal neovascularization that is often clinically missed in diabetic retinopathy patients who are graded as having severe non-proliferative diabetic retinopathy.

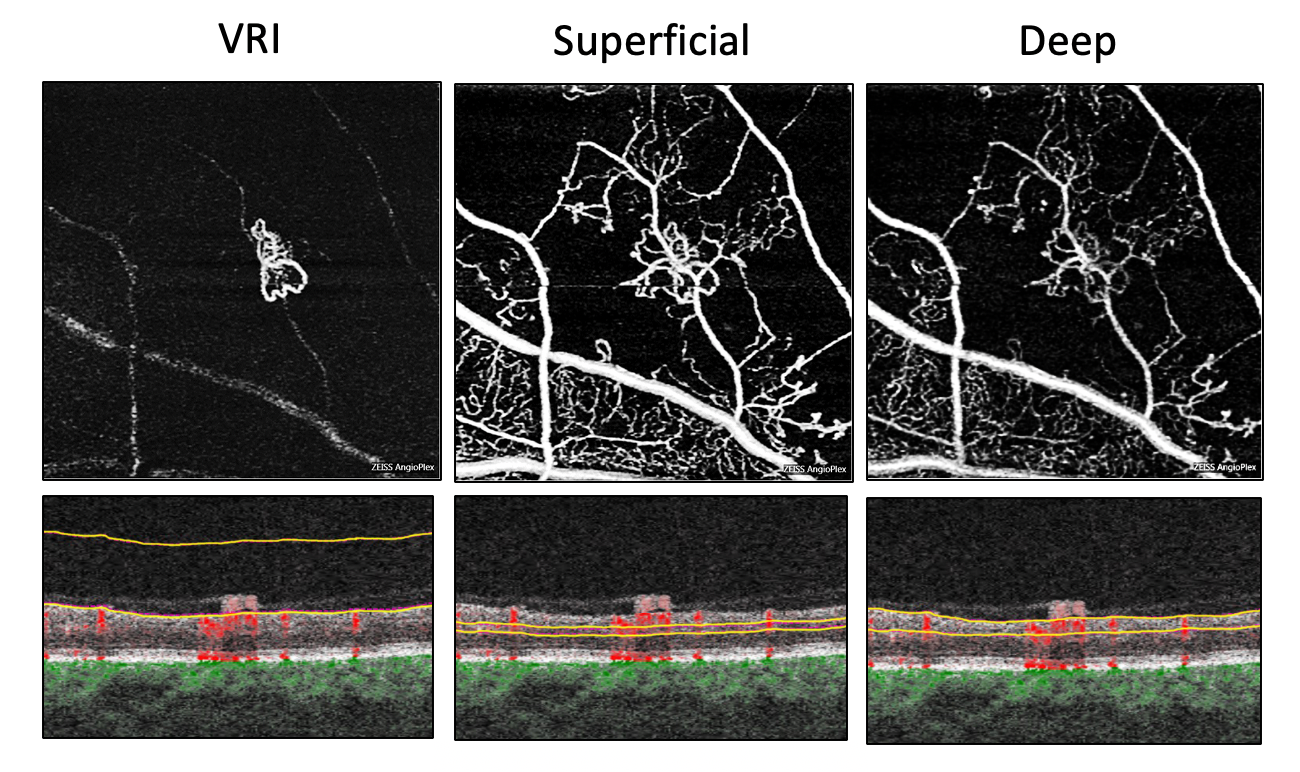
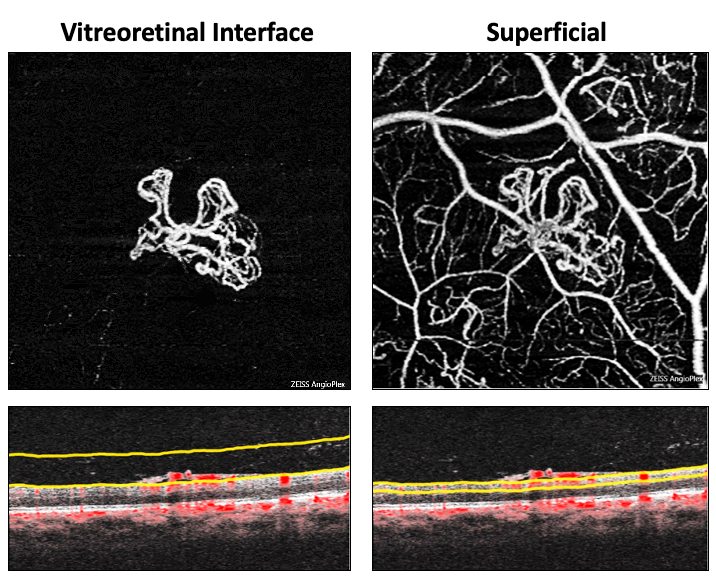
Figure 14: Sequential OCTA maps (above) show new blood vessel growth between the superficial retina and posterior vitreous in the VRI which would normally be black and devoid of blood flow movement, this vessel network can then be followed into the deep retinal layers. The B scan blood flow overlays (below) show neovascular membranes growing out of the retina and scaffolding on to the posterior vitreous. These OCTA images reliably detect early proliferative diabetic retinopathy by differentiating IRMAI from preretinal neovascularization because the neovascularization is highlighted in the VRI display.
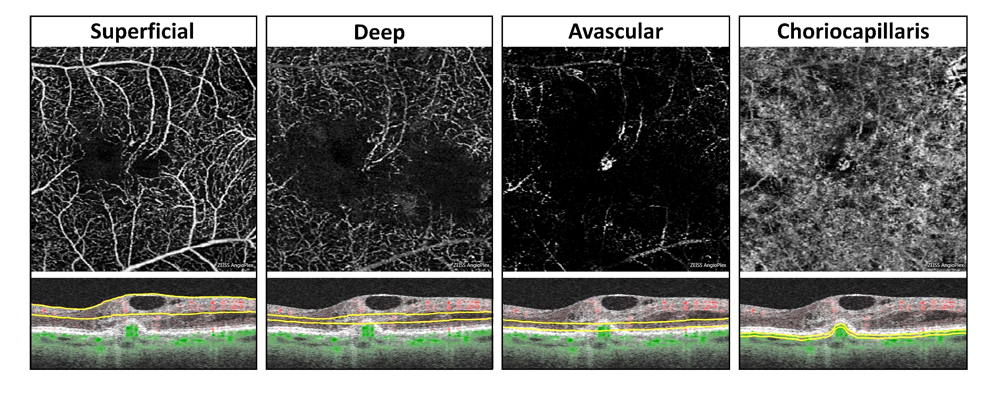
OCTA can detect early choroidal neovascularization, stemming from choroidal vasculature issues like dry and exudative AMD, by discerning the location, shape and morphology, and its exact blood flow patterns. In general, the avascular, choriocapillaris, and choroid OCTA displays should be carefully analyzed when searching for exudative and nonexudative choroidal neovascularization.9 Hypo reflectivity surrounding the choroidal neovascularization indicates that it is active and needs prompt treatment. Blood flow overlay can help confirm choroidal neovascularization where abnormal blood flow below elevated retinal pigment epithelium is indicative of this. OCTA can classify the types of choroidal neovascularization, treatment plans can be tailored according to the type, and subsequently OCTA can be used to follow treatment response and assess need for retreatment.

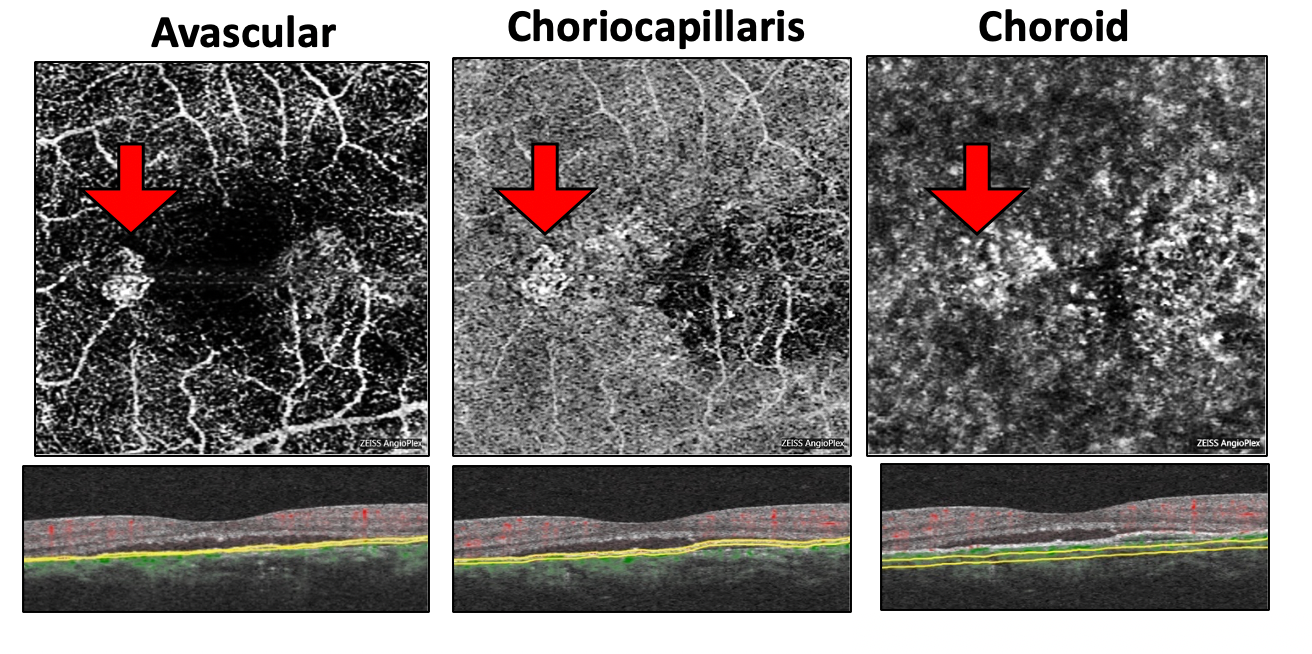
Figure 15: Sequential OCTA maps (above) and B scan blood flow overlay (below) showing exudative Type 1 subretinal pigment epithelium choroidal neovascularization (red arrows) in a central serous chorioretinopathy patient.

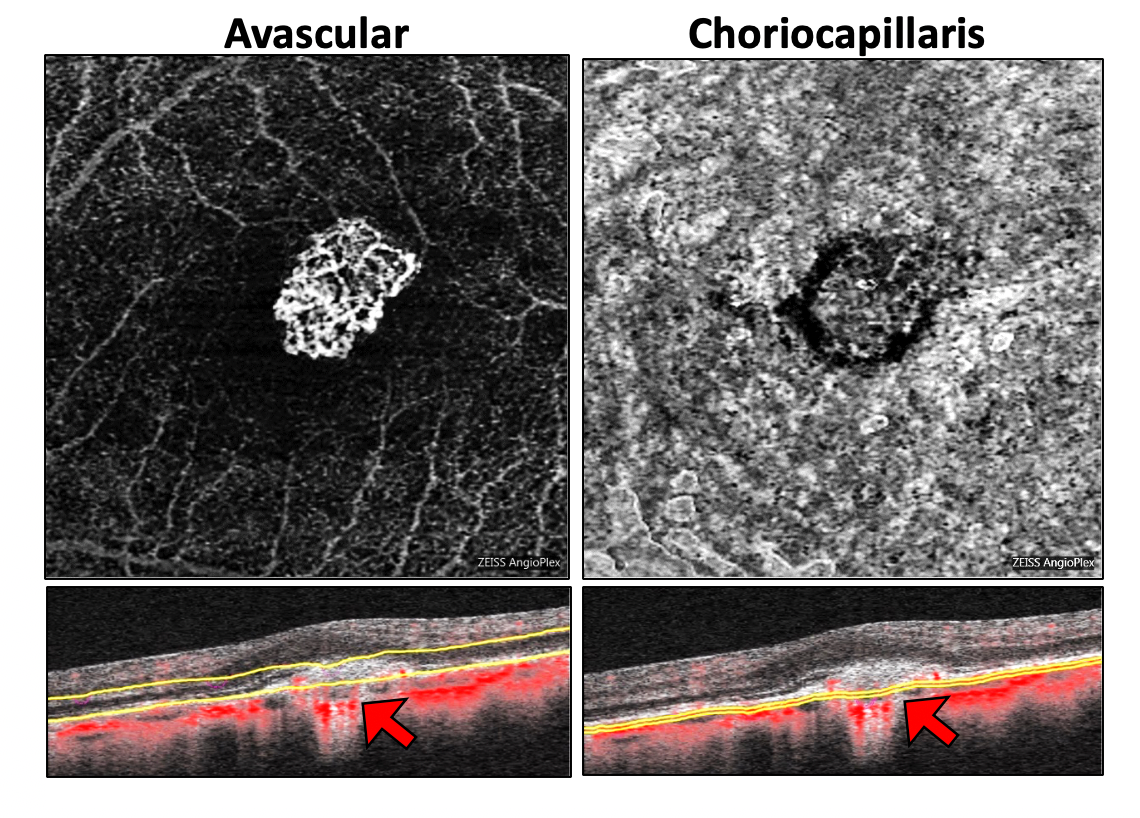
Figure 16: Sequential OCTA maps (above) and B scan blood flow overlay (below) showing Type 2 subretinal choroidal neovascularization in a highly myopic patient. Red arrows note the abnormal blood flow below the elevated retinal pigment epithelium indicating exudative choroidal neovascularization.
Case Studies
Video: OCT Angiography: Routine to Extreme Part 4
Case 1: Proliferative Diabetic Retinopathy
Background:
51yo Hispanic female
Referred with incoming DX of severe NPDR
DM type 2 x 21 years, last FBG 180 mg/dL
The following is her fundus image:

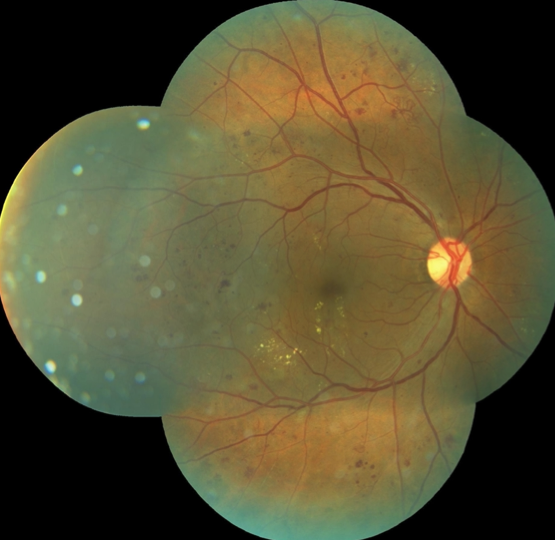
Fundus imaging does not provide clear evidence of any neovascularization.
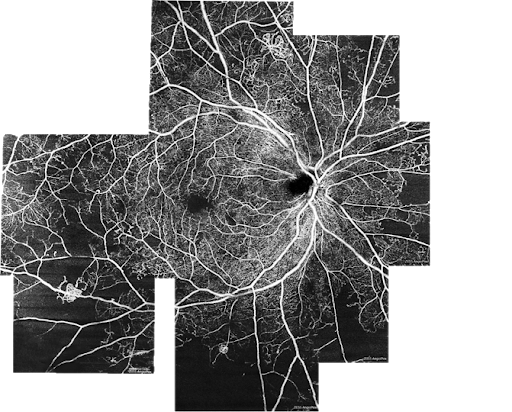
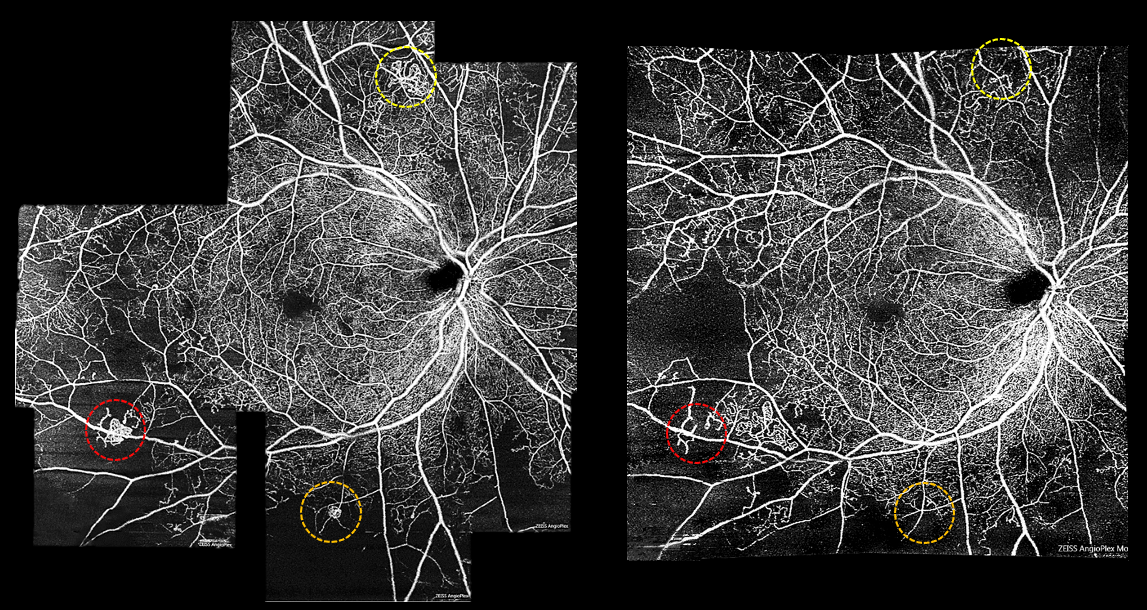
The following represents a montage of OCT-A imaging that was captured. We can appreciate non perfusion in this montage along with evidence of pre-retinal neovascular membranes.


This patient was referred for anti-VEGF treatment and returned for follow-up roughly 2 years later.
At the follow-up visit, the patient presented post PRP and anti-VEGF.
BCVA was down from 20/30 to 20/40
DME now more diffuse and center-involved which likely explains the reduction in acuity.

Left: original imaging. Right: imaging obtained on follow-up visit.
OCT-A shows worsening of peripheral non-perfusion but improvement in the neovascular membranes.

Clinical Pearls:
- OCT-A (especially wide field) allows for earlier detection of PDR
- Subtle neovascularization is often missed in eyes clinically graded as severe NPDR
- OCTA can reliably distinguish between IRMA and NVE
- NVE present on vitreoretinal interface (VRI)
- Shifting practice patterns toward earlier treatment of DR to prevent vision threatening retinopathy
- Despite treatment, worsening of peripheral non perfusion may occur in diabetic retinopathy
- We need more longitudinal studies
Video:OCT Angiography: Routine to Extreme Part 5
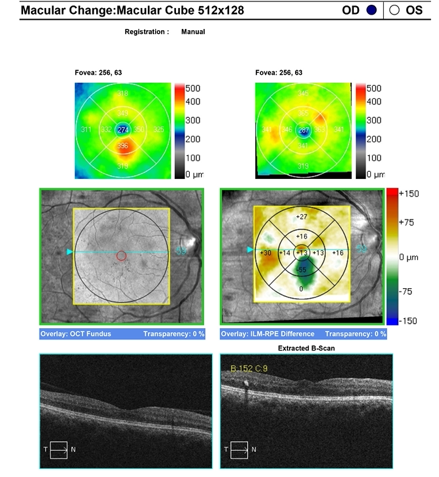
Case 2: Dry AMD with drusenoid PED
Background:
73 Caucasian female with 6-year history of dry AMD OD>OS
The following is her fundus image:

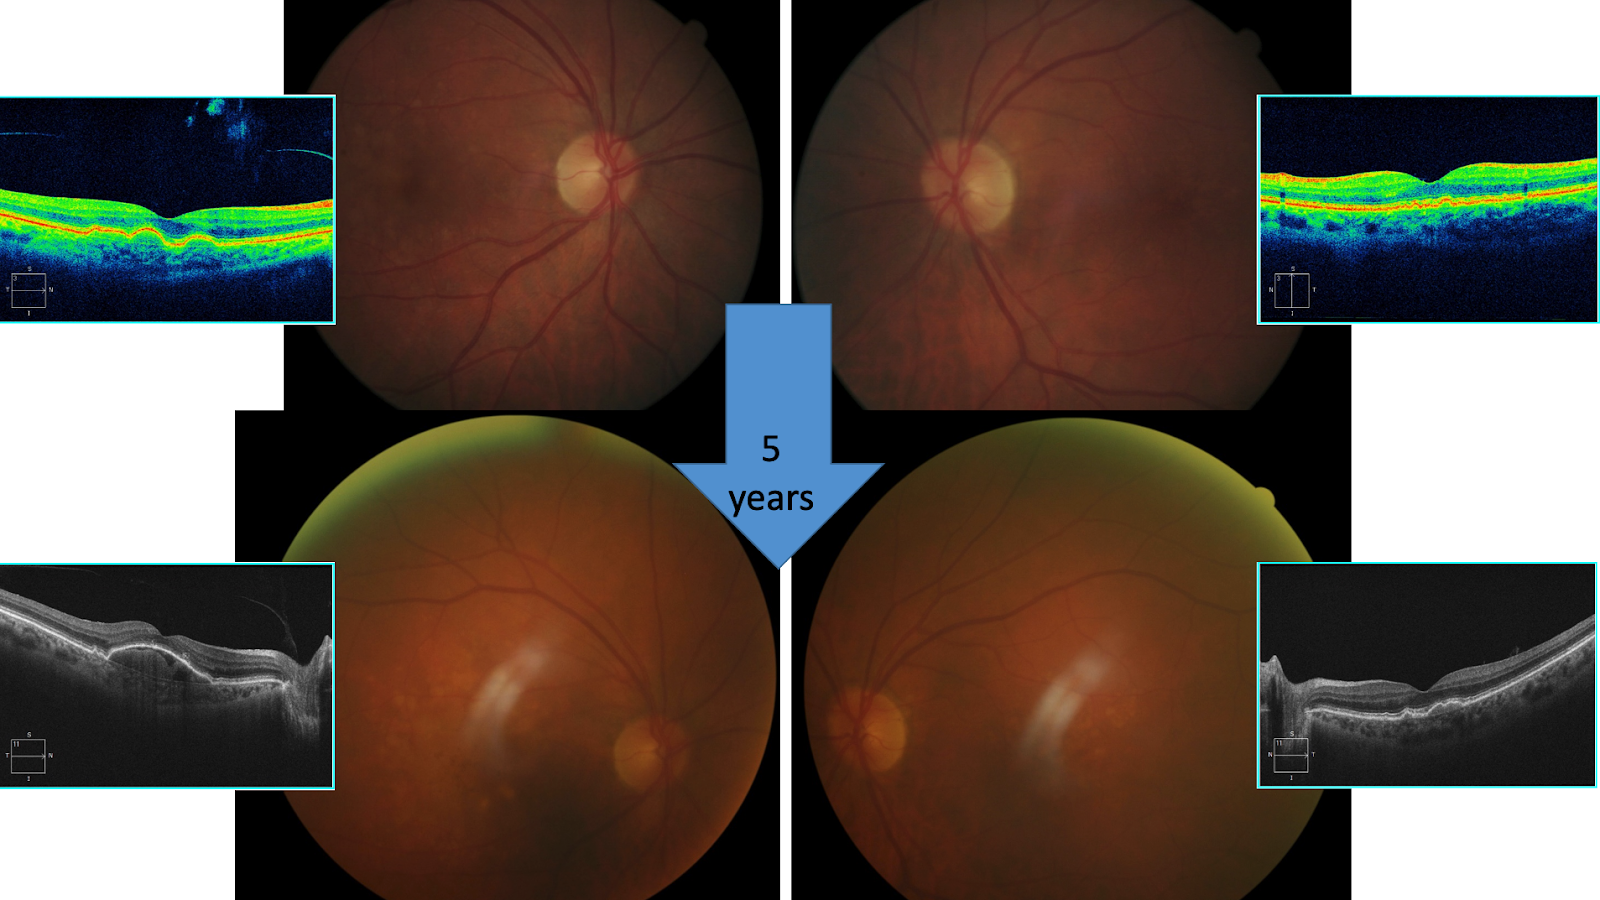
The top image above is when the patient was first seen. There are several small PED’s without subretinal fluid. The bottom picture displays 5 years later, the PED is larger.

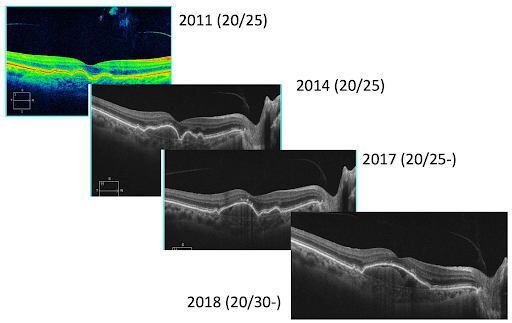
The image above represents the progression of PED over several years. With the development of OCT-A we are able to determine fluid is present.

Using flow overlay will help rule out choroidal neovascular membrane. Look underneath the PED to indicate any abnormal blood flow. The patient had an absence of vascular net noted.

The other eye has small drusenoid PEDs which cause a reduction in perfusion in choriocapillaris. Longitudinal studies are needed to understand why this is happening and how it can be clinically relevant.
Video:OCT Angiography: Routine to Extreme Part 6
Case 3: Choroidal Neovascularization | Type 3 Retinal Angiomatous Proliferation (RAP)
Background:
87yo Hispanic female
History of exudative AMD OD S/P 12 Lucentis injections- wants a second opinion of whether or not she should continue injections OD
Medical history is remarkable for DM type 2
BCVAs OD: HM, OS: 20/40

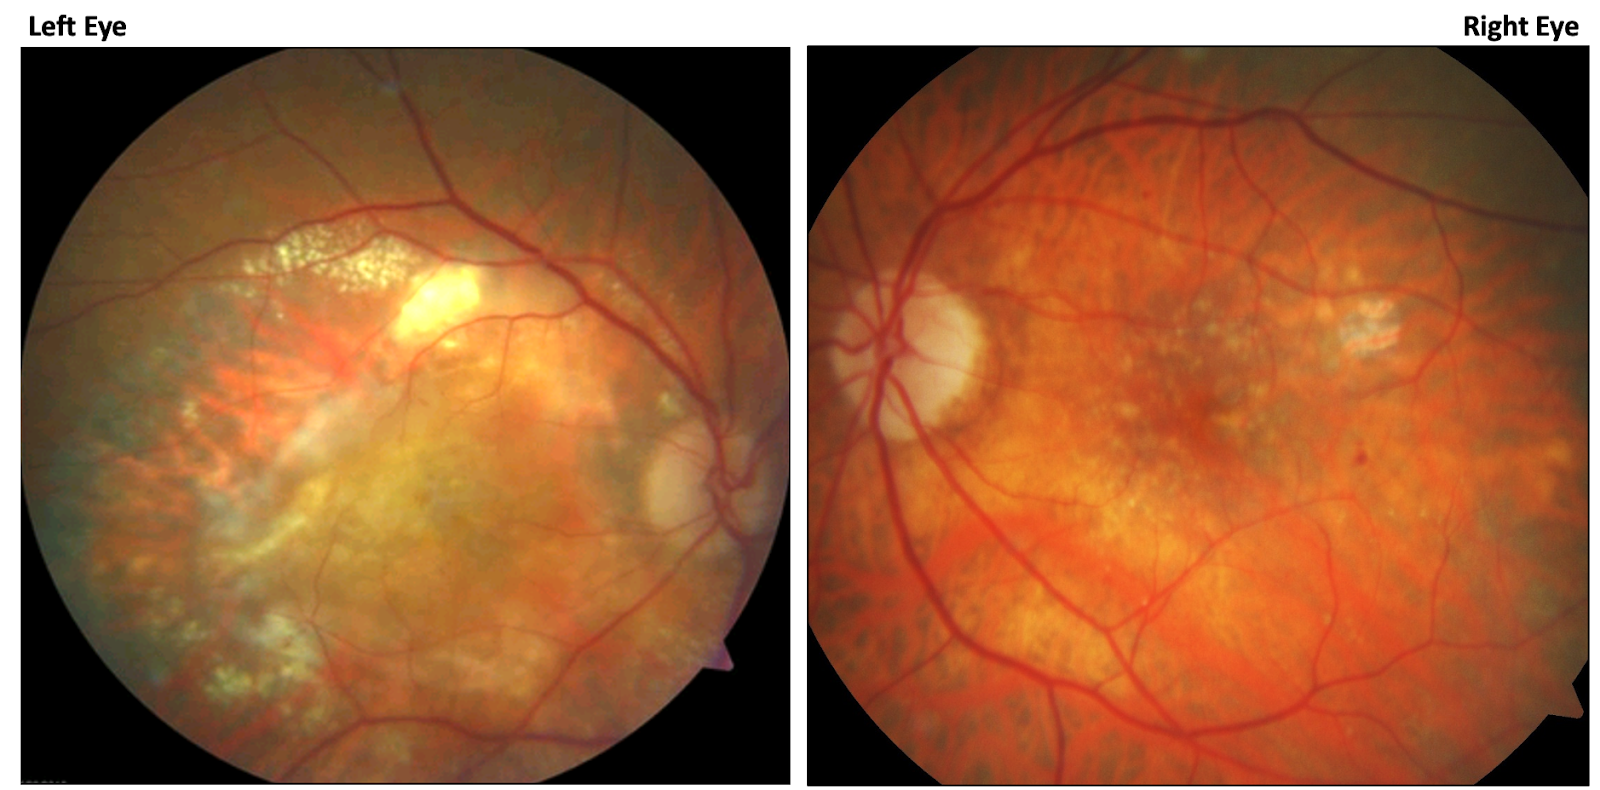
Patient’s right eye shows massive exudation, fluid, subretinal scarring. The left eye shows signs of subtle exudation and intraretinal fluid.

OCT-A can visualize the membrane itself. The superficial and deep displays abnormal vascular.
Clinical Take Home:
- OCTA allows for earlier detection of CNV in AMD = Earlier treatment = Vision preservation
- Generally, look for CNV in the avascular, choriocapillaris, and choroid en-face presets
- OCTA aids in classifying CNV type- influences prognosis and treatment response
- OCTA can be used to follow response to treatment (membrane regression) and assess need for retreatment
- Retinal non perfusion may be associated with RAP lesions in AMD—involved in the pathogenesis
Video:OCT Angiography: Routine to Extreme Part 7
Case 4: Unexplained Pallor
Background:
63 AAF
HIV, HTN, stroke, cancer, kidney disease
BP 200/120, non-compliant with 3 blood pressure meds
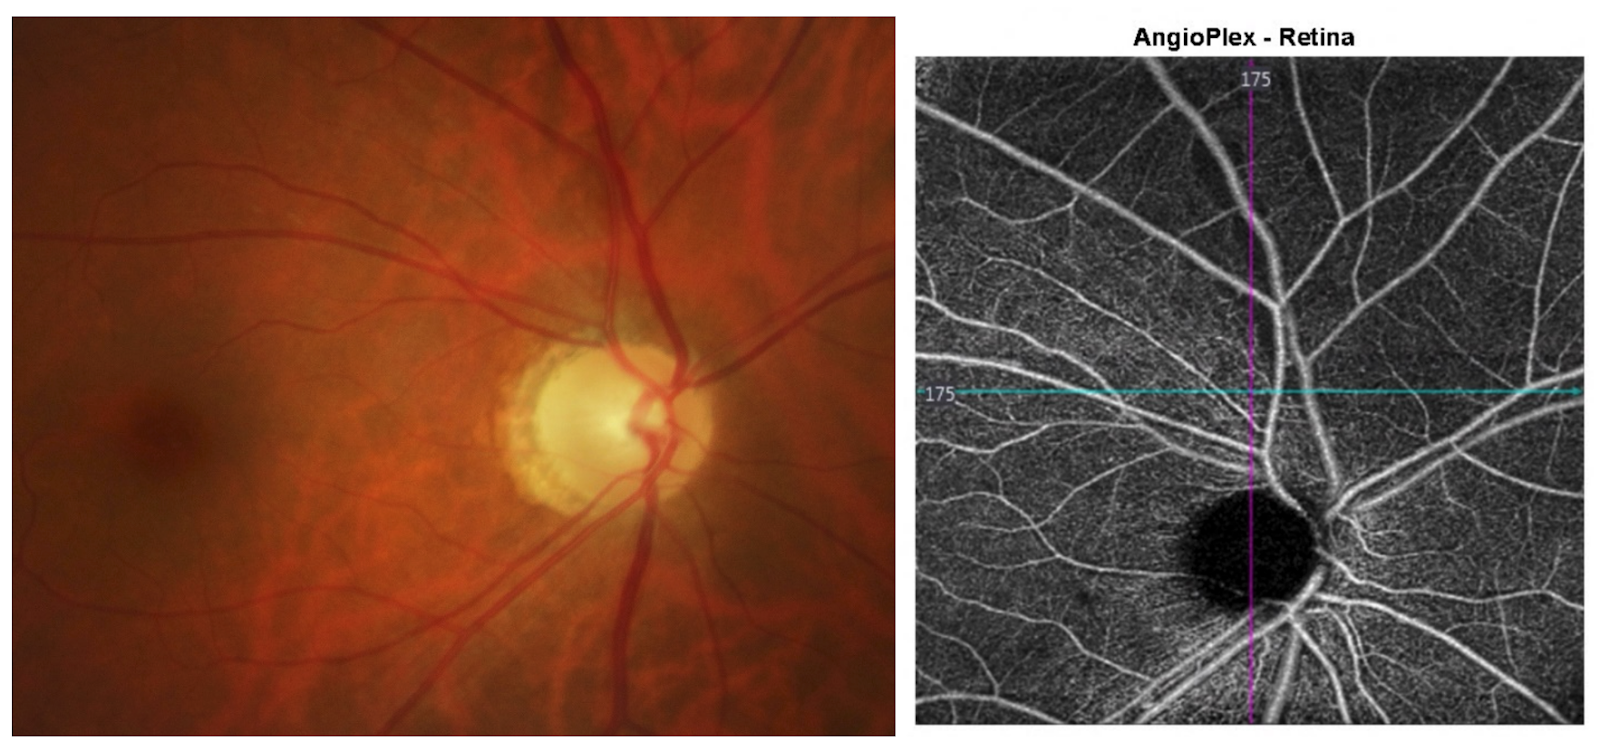
The following is the patient’s fundus image:

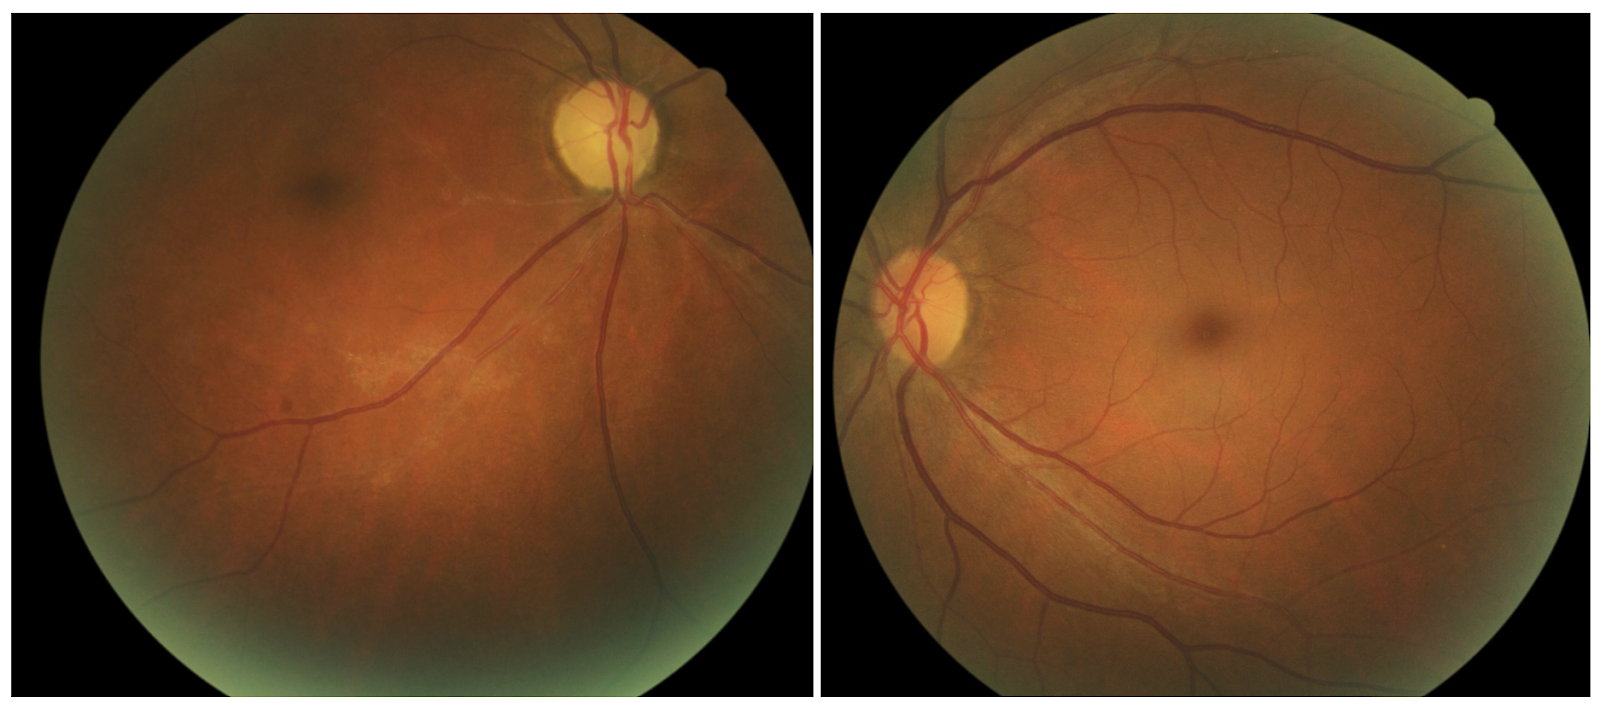
The patient presented notable pollar od
Retinal arteriolar non-perfusion
VA 5/600 +APD

The total macula thickness on the left and the intraretinal thickness on the right is impacting the inner retina. The retinal capillary plexus is evident and healthy OS.

The reduction in vessel density in SCP and DCP in NAION compared to optic neuritis from demyelinating disease
Demyelinating Disease
- OCT-derived volumes correspond to that of brain and spinal cord
- Changes in vessel density are less pronounced and appear to occur later, after RNFL/GCL damage
- Increased vessel density noted in choriocapillaris in acute disease
Video: OCT Angiography: Routine to Extreme Part 8
Case 5: Macular Telangiectasia Type 2
Background:
57yo Hispanic Female
Referred from in-house clinic for possible macular dystrophy/macular scarring OU
Chief complaint: gradually progressive vision loss OU x several years
Medical history unremarkable
BCVAs OD: 20/100, OS: 20/200
The patient’s fundus examination:


The patient’s right eye shows fovea scarring. There is atrophy in the tissue resulting in a dead space in the visualization on the right.

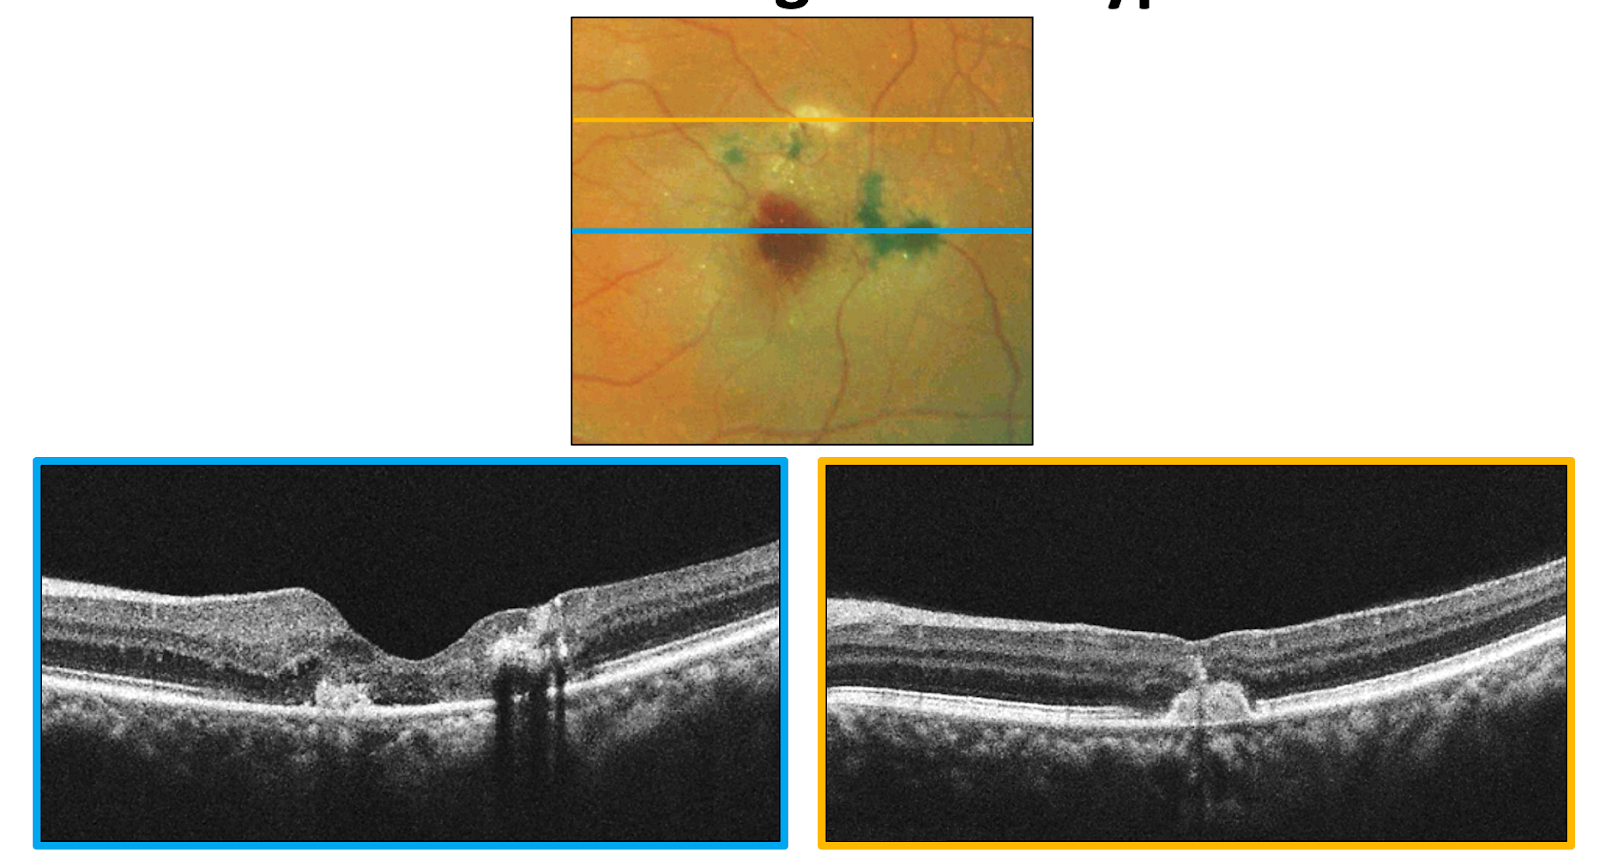

The patient’s left eye displays grey subretinal thickening and a small area of subretinal fluid.

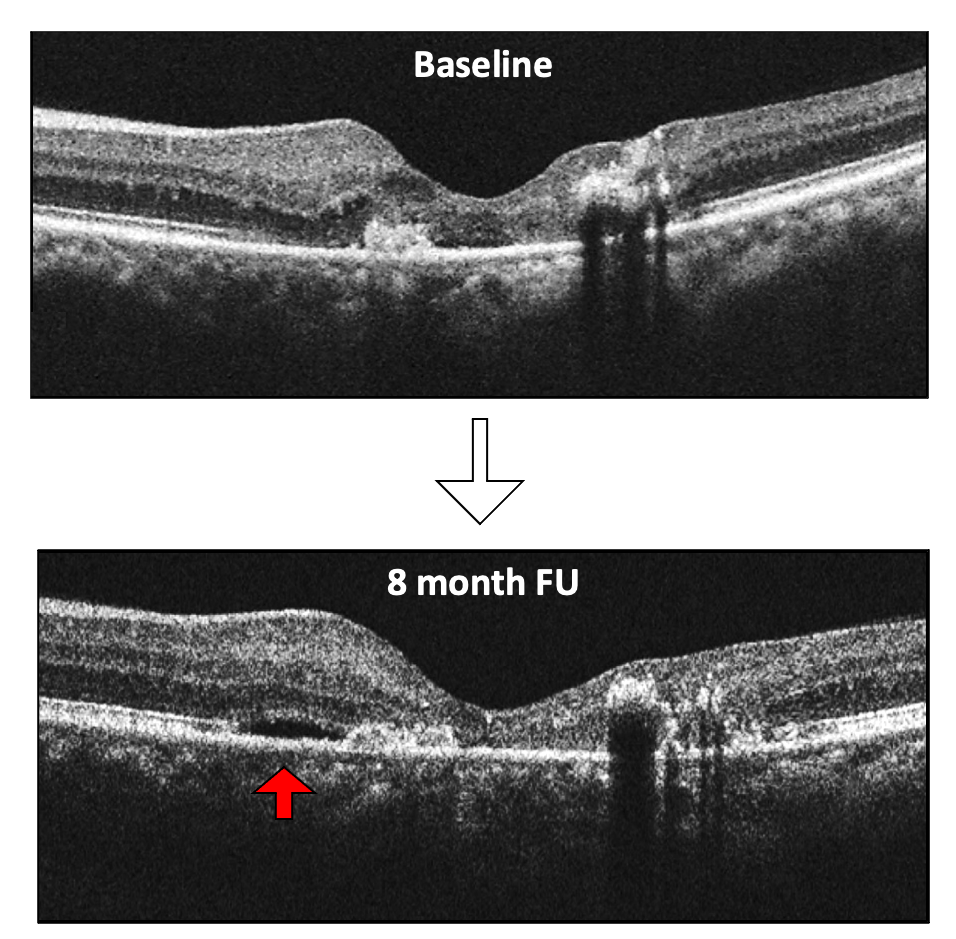
The patient was referred based on the appearance of what looked like to be choroidal neovascularization to see if they were truly exudative or not. 8 months later, the patient feels their vision is worse. There is new adjacent subretinal fluid next to the subretinal neovascular membrane, which requires treatment.
Clinical Take Home:
- OCTA aids in the detection of subretinal neovascularization in macular telangiectasia type 2
- Macular telangiectasia type 2 eyes with active subretinal neovascularization should be referred for consideration of treatment
- Better prognosis - earlier treatment and small size neo
- OCTA allows for earlier detection of perifoveal telangiectasia in early, subclinical macular telangiectasia type 2
Other Applications of OCT-A
Video: OCT Angiography: Routine to Extreme Part 9
Conclusion
Conclusion
OCTA can detect various vascular abnormalities earlier, allowing for aggressive systemic management such as more follow ups, proper referral sources, and improved patient education. OCTA can add a level of confidence to the diagnosis and management of patients with vascular disease and provides additional information about vascular pathology to standard dye-based angiography. OCTA has several clinical implications and applications, though, there is still much to learn because it will likely have more in the future, like in glaucoma and neurological disorders.
References
- Nghiem-Buffet S, Ayrault S, Delahaye-Mazza, C. Practical OCT Angiography. Carl Zeiss Meditec.
- You QS et al. Ultra-wide OCTA in DR. Retina. 2019.
- Branch Vein Occlusion Study Grp. Argon laser scatter photocoagulation for prevention of neovascularization and vitreous hemorrhage in BVO. A RCT. Arch Ophthalmol.1986.
- Winegarner et al. Retina.2018.
- Nassisi M, et al. Choriocapillaris impairment around the atrophic lesions in patients with GA: a SS-OCTA study. Br J Oph. 2018.
- J Neuroophthalmol. 2019
- Multiple Sclerosis. 2019
- Br J of Ophthalmol. 2018
- Carnevali A, et al. OCTA: A Useful Tool for Diagnosis of Treatment-Naïve Quiescent CNV. Am J Ophth. 2016.


